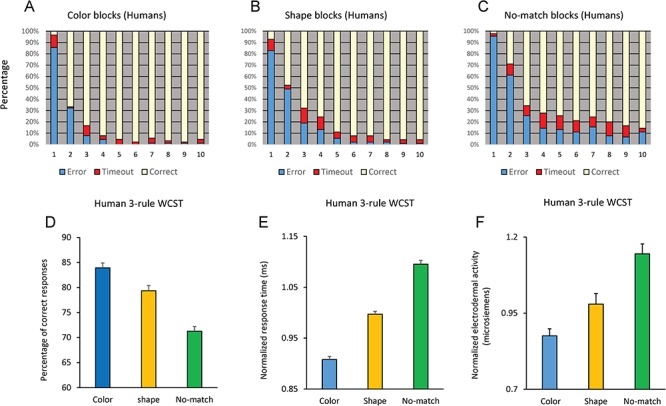
Figure 3.

Performance of humans in the 3-rule version of the WCST. (A–C) Mean percentage of responses are shown in 10 trials after the rule shift when color (A), shape (B), or no-match (C) rule was relevant. (D) Mean percentage of correct responses when color, shape or no-match rule was relevant. (E) Mean-normalized response time in correct trials when color, shape, or no-match rule was relevant. (F) Mean-normalized EDA is shown when participants implemented color, shape, and no-match rules. P values for the pairwise comparisons of color and shape dimensions (paired t-test) are shown.
