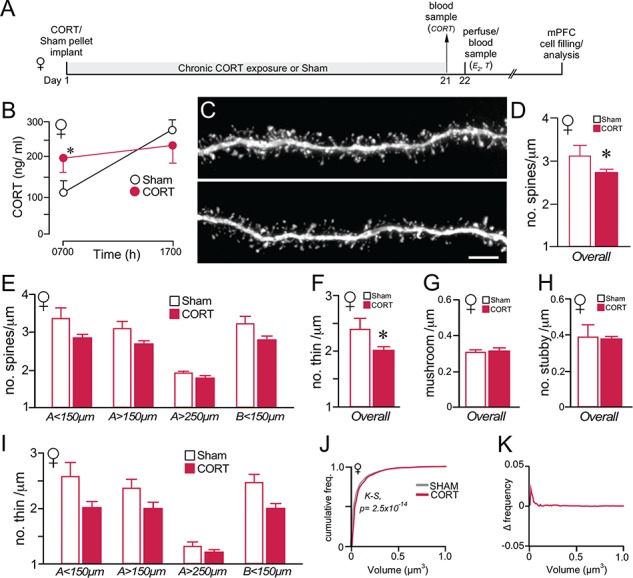
Figure 5.

Chronic CORT effects on PL dendritic spine morphology in female rats. (A) Timeline of the second experiment; this is same design as in a previous experiment of ours comparing the effects of chronic CORT exposure on PL dendritic spine morphology in male rats (Anderson et al., 2016). (B) Graph depicting mean ± SEM plasma CORT levels at AM and PM sampling of plasma CORT levels on day 21 of the experiment. Blood samples were collected to verify CORT implant (s.c.) efficacy relative to sham rats implanted with cholesterol pellets. (C) Examples of deconvolved images of dendritic segments from layer 2/3 pyramidal neurons in PL. Scale bar = 5 μm. (D, E) Overall (D) spine densities are decreased following chronic CORT exposure, along with nonsignificant downward trends across dendritic distances (E). (F–H) Chronic CORT treatment decreased thin spine (F), but not mushroom (G) or stubby (H) subtype density. (I) Breakdown of thin spine loss following CORT treatment as a function of different dendritic compartments, illustrates trends but no significant decreases at all distances. *, P < 0.05 (N = 7 CORT; N = 5 Sham). (J) Cumulative distribution frequencies of overall spine volume in PL neurons reveal rightward shifts (i.e., increase) in the CORT versus control group. (K) Graph displaying the difference between each function in J, with positive values indicating that spines up to that volume comprise a greater proportion of the CORT than control group. K-S, Kolmogrov-Smirnov test, significance set at P < 0.01.
