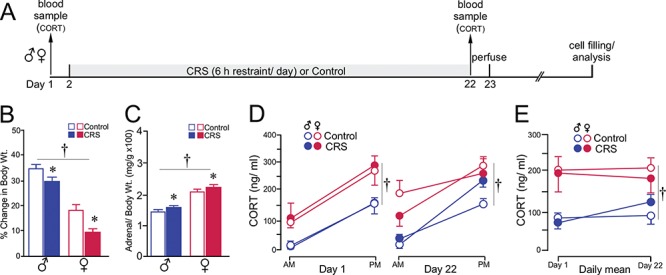
Figure 6.

CRS produces a comparable adrenocortical signature in both sexes. (A) Timeline of the third experiment. (B, C) Both groups of rats showed decreases in body weight gain (B) and adrenal hypertrophy (C) through the course of the 21-day CRS period. (D) Graph depicting mean ± SEM plasma CORT levels at AM and PM sampling of CORT as a function of sex and treatment group. Measurements were taken in the same rats prior (day 1) to and following (day 22) CRS. (E) Graph showing changes in the daily mean values of plasma CORT levels pre- and post-CRS as a function of sex and treatment group. Although sex differences in plasma CORT were evident (†, P < 0.05), CRS did not result in any significant increase in CORT levels, as contrasted by the effects of CVS (i.e., compare with Fig. 1E). N = 6–8/group.
