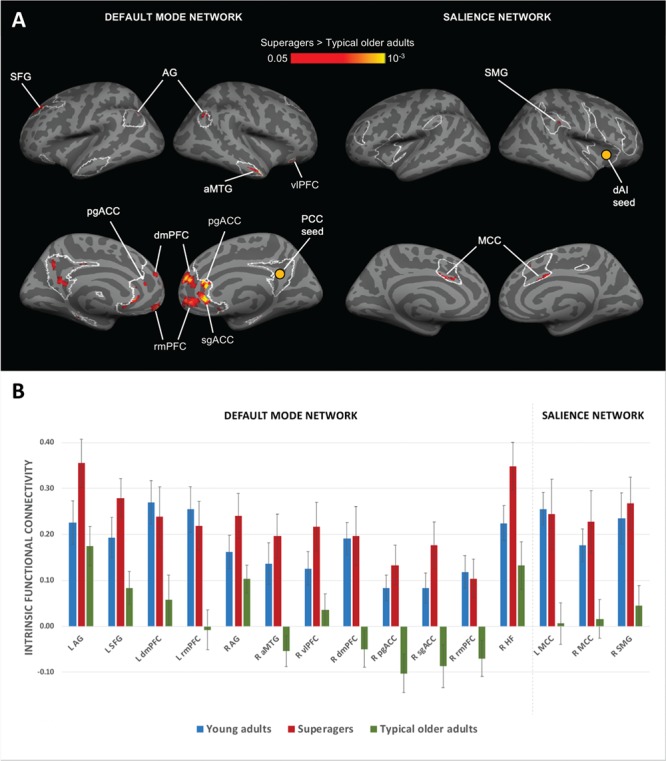
Figure 1.

Stronger DMN and SN connectivity in superagers. (A) Regions of the DMN and SN (outlined in white) where superagers had stronger intrinsic functional connectivity than did typical older adults (red/yellow). For each network, a 2-sample t-test between superagers and typical older adults was conducted. Maps were thresholded at P < 0.05 and masked by network masks shown in Figure S1. We did not observe any region with higher connectivity in typical older adults than in superagers. We excluded clusters in the left precuneus/PCC region from further analyses because they showed high auto-correlation. (B) Bar graphs show superagers had stronger intrinsic connectivity within DMN and SN than did typical older adults (P < 0.05) but similar connectivity to young adults (P > 0.05). We calculated intrinsic connectivity strength between each network seed and its targets identified from peaks in the t-test maps in Figure 3. R, right hemisphere; L, left hemisphere. Error bars indicate 1 standard error of the mean. In several comparisons, the bars for superagers (orange) were higher than those for young adults (blue) and the error bars did not overlap. However, statistically, superagers were indistinguishable from young adults in all comparisons.
