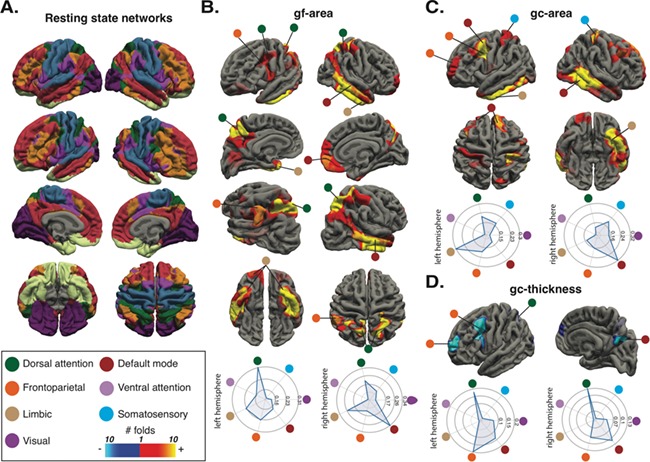
Figure 3.

Correspondence between structural correlates of intelligence and functional resting-state human networks. Group-average (N = 1000) resting-state human networks by Yeo et al. (2011) (A). gf-cortical surface area associations (B), gc-cortical surface area (C), and gc-cortical thickness associations (D). The radar graphs show the DC for each network. The circles show the correspondent network.
