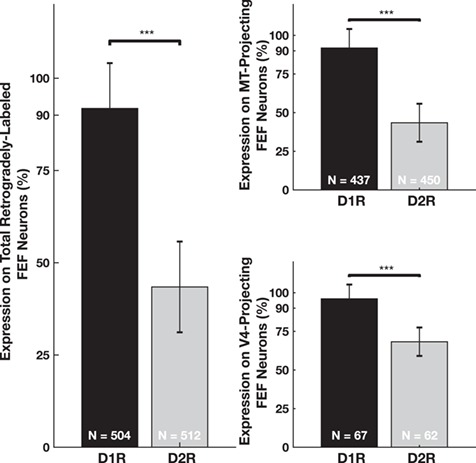
Figure 11.

Relative proportion of D1R- and D2R-expressing visual cortex-projecting FEF neurons. The left panel shows the proportion of the 2 populations (V4-projecting and MT-projecting) of neurons that express either D1Rs or D2Rs. The top-right panel shows the proportion of MT-projecting neurons that express either D1Rs or D2Rs. The lower-right panel shows the proportion of V4-projecting FEF neurons that express either D1Rs or D2Rs. *** denotes significance at the level of 0.001 after Bonferroni correction. Significance was determined using chi-squared tests calculated on total counts. Ns displayed on the bars. Combined P < 10−16, MT-projecting P < 10−16, V4-projecting P = 5 × 10⁻⁴. Bar heights and standard error bars are calculated from the across-animal mean proportions and the exact values are described in the main text (N = 3 for all comparisons).
