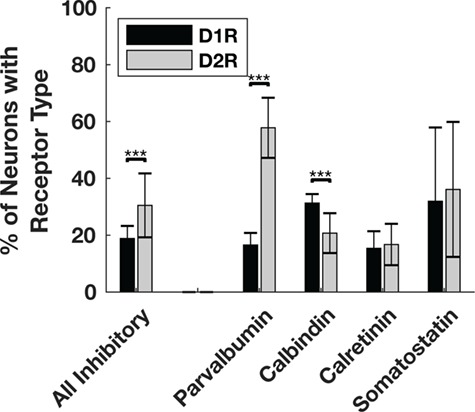
Figure 6.

Proportion of inhibitory interneuron classes that express D1Rs or D2Rs. A significantly higher proportion of parvalbumin+ inhibitory interneurons express D2Rs than D1Rs. A significantly higher proportion of calbindin+ inhibitory interneurons express D1Rs compared with D2Rs. When pooling across interneuron classes, the proportion of D2R-expressing interneurons is significantly greater than the proportion of D1R-expressing interneurons. We did not perform a statistical comparison between D1R- and D2R-expressing somatostatin+ neurons because they were so rare. *** denotes significance at the level of 0.001 after Bonferroni correction. Significance was determine using chi-squared tests calculated on total counts (Parvalbumin+ N = 635, P < 10−16; Calbindin+ N = 624, P = 5.7 × 10⁻⁵; Calretinin+ N = 648, P = 0.42). Bar heights and standard error bars are calculated from the across-animal mean proportions and the exact values are described in the main text. Animal Ns respectively for Parvalbumin+ D1R, D2R = 4, 3; Calbindin+ D1R, D2R = 4, 4; Calretinin+ D1R, D2R = 3, 4; Somatostatin+ D1R, D2R = 3, 4.
