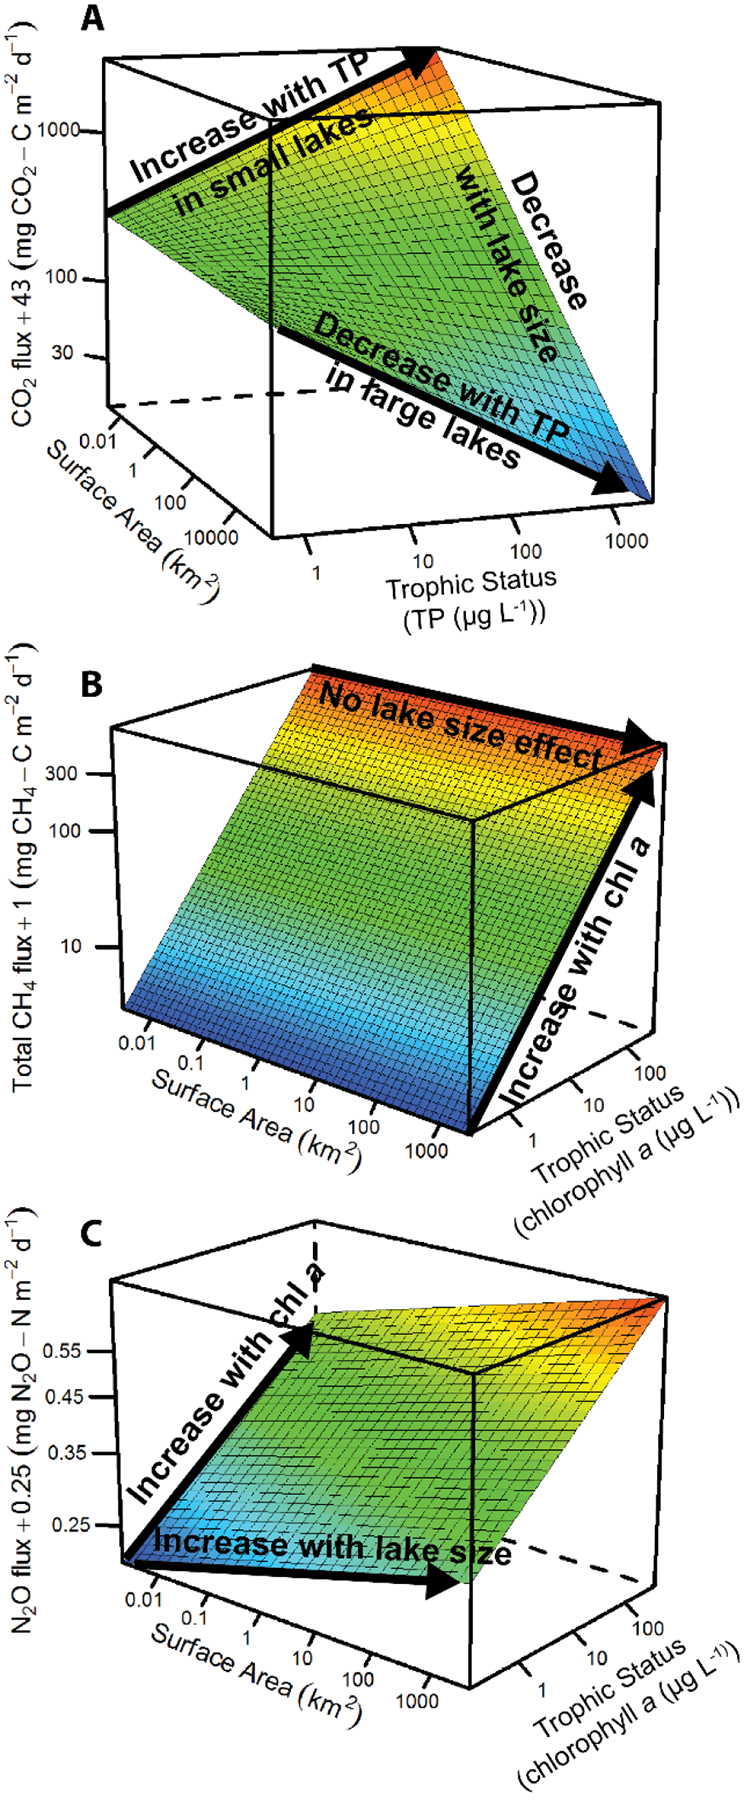
Figure 1.

Size-productivity weighted (SPW) models for GHG emissions from lakes and impoundments. (A) CO2 emissions best explained by surface area (SA), trophic status via TP, and the interaction between the two. (B) A linear relationship with chla, also a trophic state proxy, is the best model for total CH4. (C) SA and chla (but no interaction) best explain N2O emissions.
