
Figure 1.
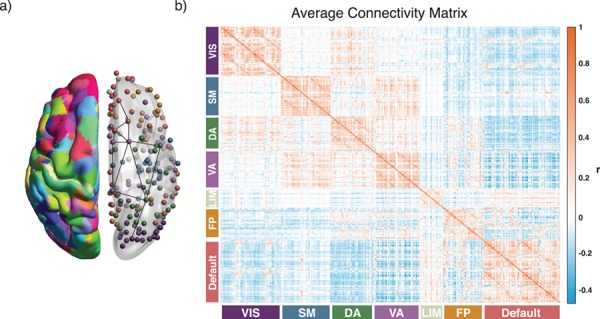
Schematic of approach. (a) A total of N = 360 regions of interest in a multimodal cortical parcellation (Glasser et al. 2016). From each region, we estimated the mean BOLD timeseries, and then we calculated the functional connectivity between any two regions using the Pearson correlation coefficient. For each subject, we collated all functional connectivity estimates into a single N × N adjacency matrix. The left hemisphere depicts the parcellation, while the right hemisphere depicts regions represented as network nodes and colored by their association to putative cognitive systems (Yeo et al. 2011). (b) The average functional connectivity matrix across subjects, ordered by putative cognitive systems. VIS: visual; SM: somatomotor; DA: dorsal attention; VA: ventral attention; LIM: limbic; FP: frontoparietal.