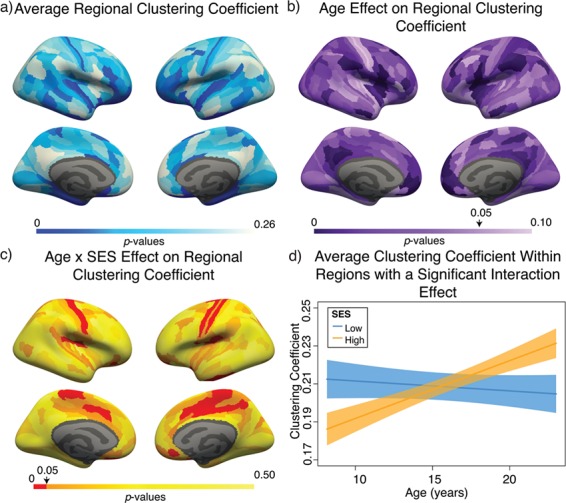
Figure 4.

Variation in age and SES is associated with region-level functional network topology at rest. (a) On average, values of the clustering coefficient are largest in the precuneus, middle temporal gyrus, and inferior frontal gyrus. (b) Regional P values for the effect of age on the clustering coefficient. By visually comparing panel (b) with panel (a), we observe that regions with high clustering coefficient tend to show positive associations between clustering coefficient and age. (c) Regional P values for the effect of SES on associations between age and the clustering coefficient. Significant age-by-SES interactions are located in the limbic, somatomotor, and ventral attention systems. Image is thresholded to control for multiple comparisons using a false discovery rate of q < 0.05; significant regions are shown in red. (d) SES effects on the positive relationship between age and the clustering coefficient, extracted from only nodes that show a significant age-by-SES interaction.
