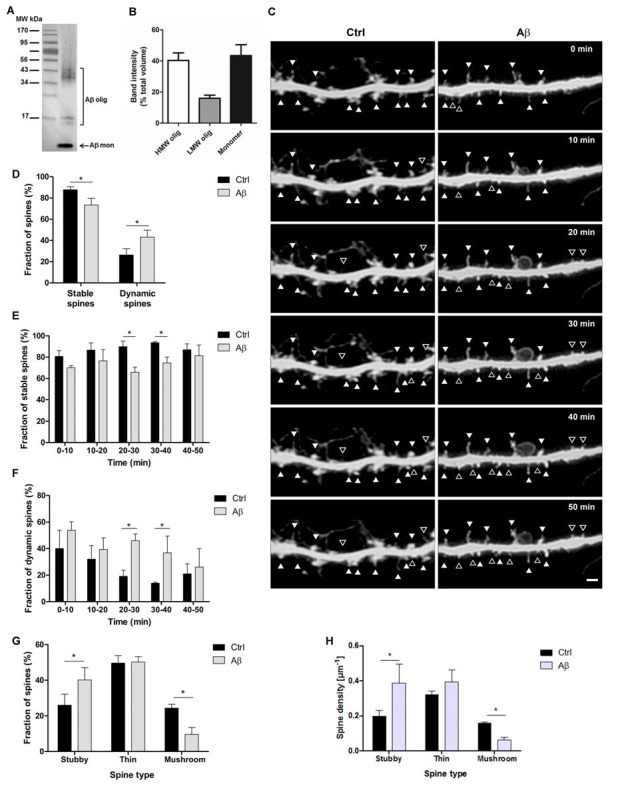
Figure 1.

Stability and dynamics of dendritic spine types during short amyloid β (Aβ) treatment. (A) Representative western blot shows the broad range of molecular weight protein markers (lane 1) and oligomeric and monomeric forms (lane 2) of Aβ(1–42) preparation probed with monoclonal antibody 6E10. (B) The bar graph illustrates the relative quantification (band intensity expressed as the percentage of band volumes of total proteins) of high molecular weight (HMW), low molecular weight (LMW) and monomeric forms of Aβ preparation (n = 4 preparations). (C) Micrographs show confocal time-lapse images of dendritic segments displaying stable spines (filled arrowheads) and dynamic spines (open arrowheads) at 10-min intervals in control and Aβ conditions. Scale bar, 2 μm. (D) Bar diagram representing the cumulative average of dendritic spine stability and dynamics at during 50 min interval. (E,F) Bar graphs represent quantification of stability (E) and dynamics (F) of control and Aβ-treated spines at the indicated 10 min interval. (G,H) Detailed analysis of the percentage (G) and density (H) of the three types of dendritic spines in the 30–40 min time interval. *p < 0.05, compared to non-treated cells; paired one-way ANOVA, n = 8 dendrites, of eight neurons (30 spines/dendrite).
