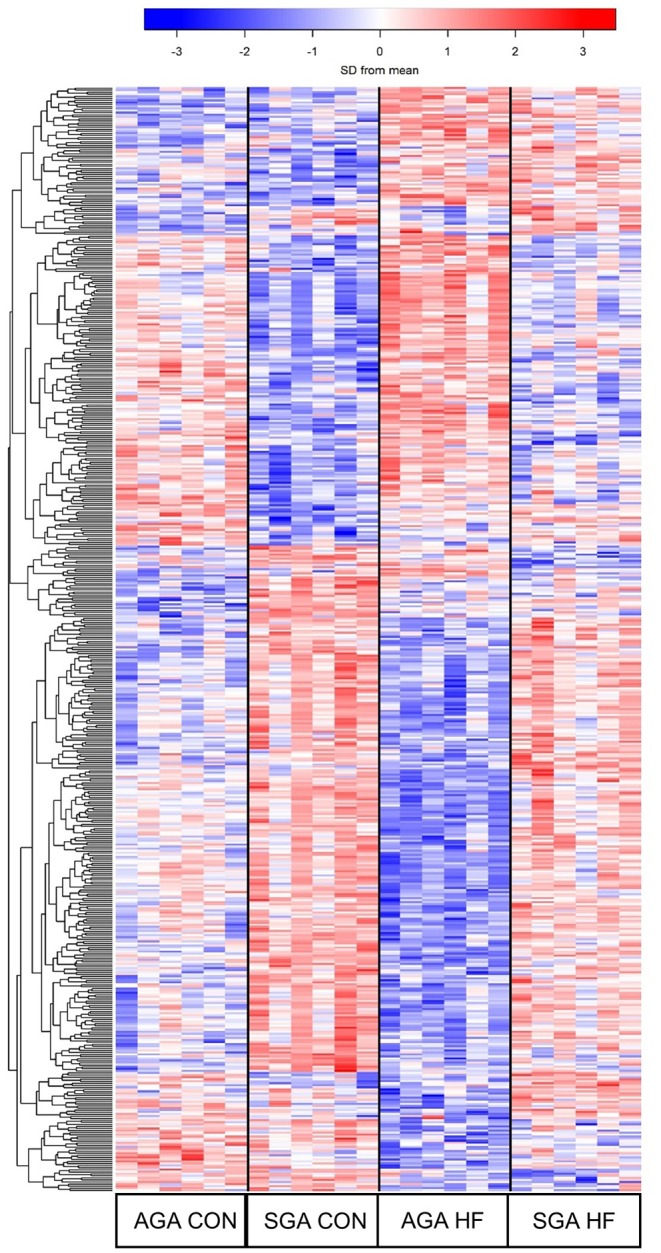
Figure 5.

Heat map demonstrating the unique gene expression patterns in the hippocampi due to SGA and HF diet. Each row represents a gene and its relative expression (blue = down-regulation; red= up-regulation) in each piglet. 319 DEGs were identified in response to SGA, 105 DEGs were identified in response to diet, and 24 DEGs were involved in a SGA by diet interaction. AGA CON n = 6, AGA HF n = 6, SGA CON n = 6, SGA HF n = 6. AGA, appropriate for gestational age; SGA, small for gestational age; CON, control; HF, hydrolyzed fat; DEG, differentially expressed genes.
