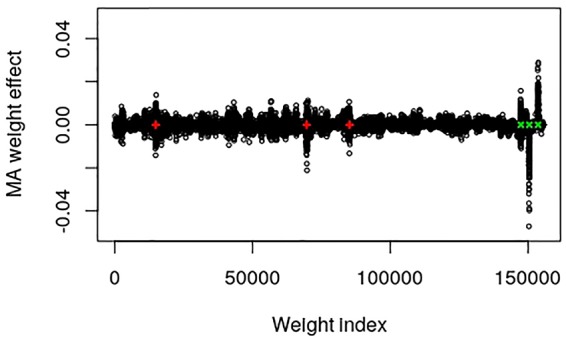
Figure 1.

Plot of model averaged weight effects against weight index in the output layer of the simulated QTLMAS2010 data. The true major additive (including the additive part of the epistatic) QTLs are marked in red + and the dominance QTLs are in green ×.
