Figure 2.

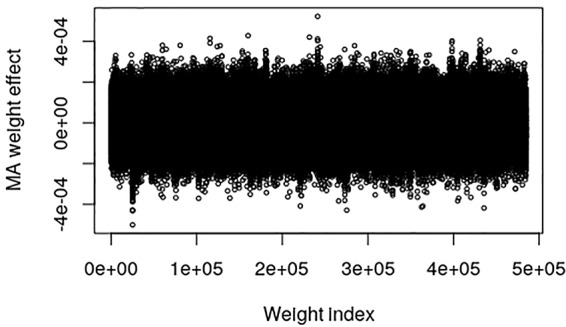
Plot of model averaged weight effects against weight index in the output layer when breeding values (EBVs) of the Austrian pig data are used as phenotypes.

Plot of model averaged weight effects against weight index in the output layer when breeding values (EBVs) of the Austrian pig data are used as phenotypes.