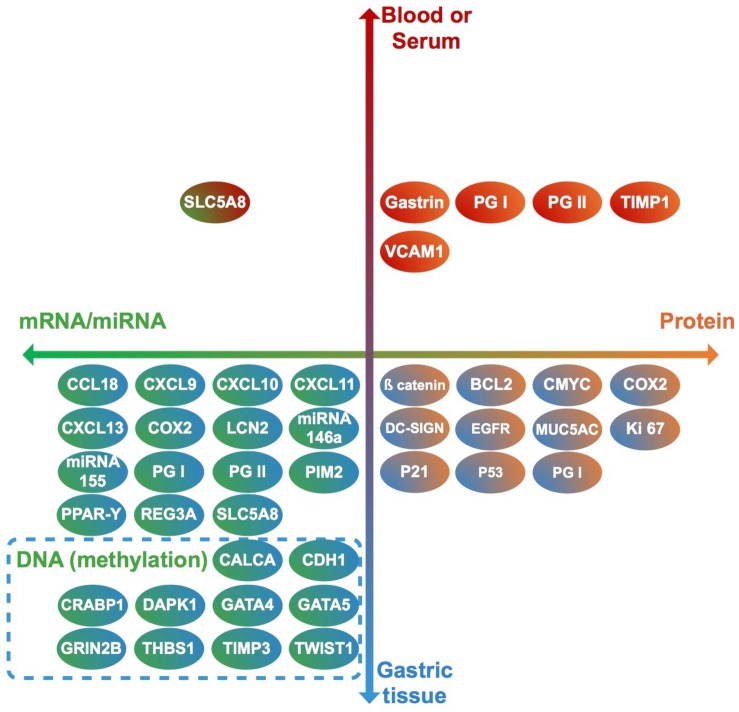
FIGURE 2.
Clinical samples used to analyze each biomarker (vertical axis), and molecules identified in each case (horizontal axis). Each biomarker identified in this review is represented by a circle. Upper half: biomarkers analyzed in blood or serum. Lower half: biomarkers analyzed in gastric tissue. Right half: Biomarkers identified as proteins. Left half: biomarkers identified as RNA or DNA. Genes (DNA) in which methylation levels were analyzed are surrounded by a dashed rectangle.

