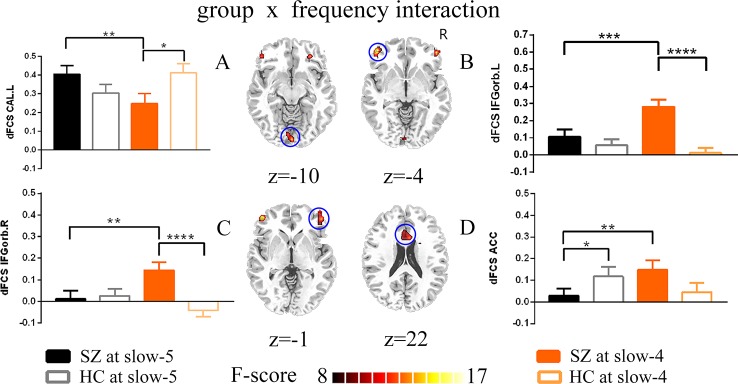
Figure 4.
The interaction between the group and frequency band (slow-5 and slow-4) on dFCS. The results were obtained by two-way ANOVA and post-hoc test (p<0.005, uncorrected). (A–D) separately represent significant group *frequency interactions and post-hoc test of the left calcarine, the left inferior orbitofrontal cortex, the right inferior orbitofrontal cortex and the anterior cingulum. The data were expressed as the mean value and standard error. *p<0.1, **p<0.05, ***p<0.005, ****p<0.0001. ANOVA, analysis of variance; dFCS, dynamic functional connectivity strength; SZ, patients with schizophrenia; HC, healthy controls; CAL.L, the left calcarine; IFGorb.L, the left inferior orbitofrontal cortex; IFGorb.R, the right inferior orbitofrontal cortex; ACC, the anterior cingulum.

