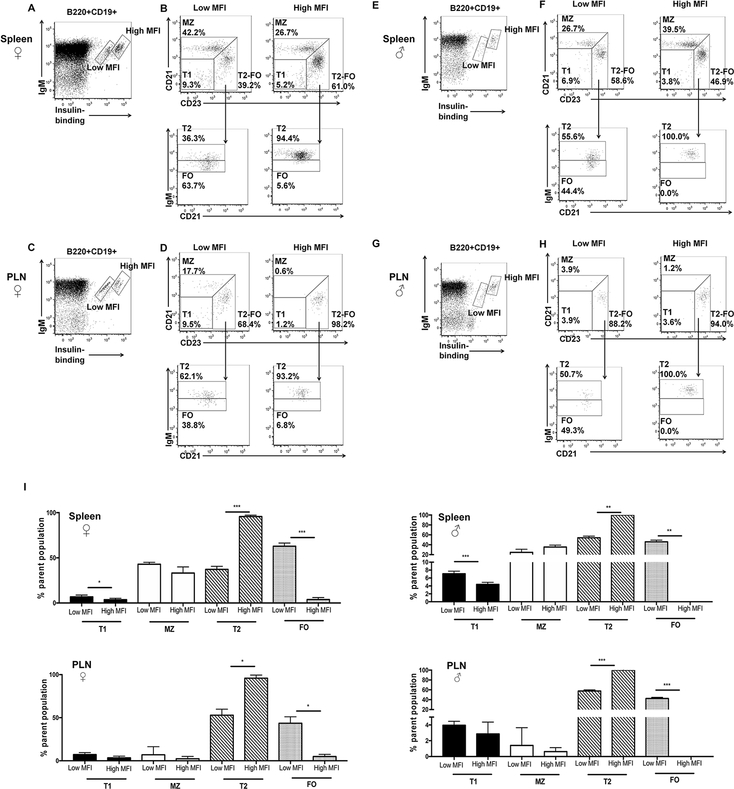
Fig. 2. Insulin-binding B cells are enriched in distinct subsets in VH125SD.NOD mice.
Cell suspensions from the spleen and PLNs of male and female, pre-diabetic, 8–12 week old mice were analyzed by flow cytometry. (A-G) Representative dot plots on B cells (B220+CD19+) from spleens and PLNs stained with IgM and biotinylated insulin to identify different populations of insulin-binding B cells (A, C, E, G) designated as “low MFI” and “high MFI” (boxes). (B, D, E, H) Flow-cytometry phenotyping on insulin-binding B cells residing in “low MFI” (left) and “high MFI” (right) populations. Upper plots identify T1, MZ and T2-FO subsets based on CD23 and CD21 staining. Lower plots (arrow) distinguish T2 and FO subsets using IgM and CD21 staining. Percentages reflect the percentage of the parent population. (I) Mean ± SD for percentages of B cell subsets for spleen and PLNs in male and female mice; n≥3 mice per group. *p<0.05, **p<0.01, ***p<0.001, paired, two-tailed t test.

