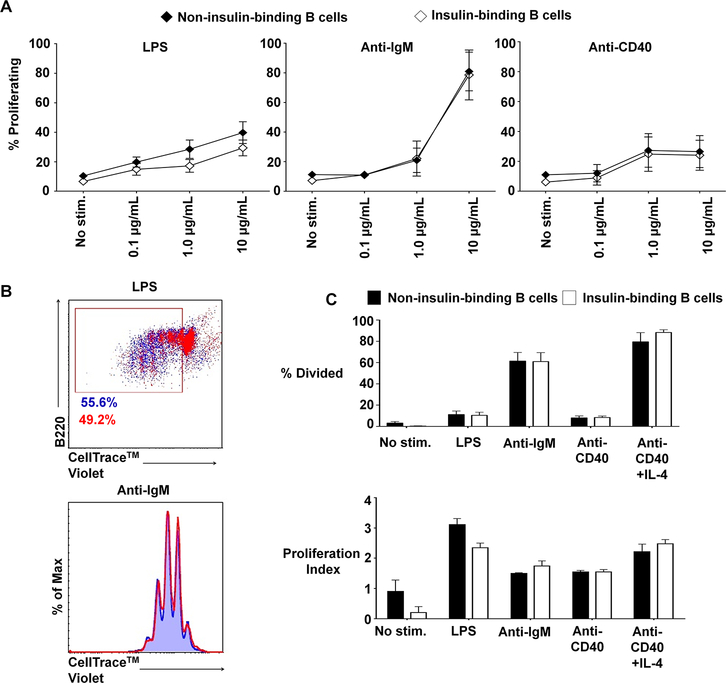
Fig. 4. Insulin-binding B cells in VH125SD.NOD mice proliferate normally in response to mitogens.
B cells purified from VH125SD.NOD mice were cultured with LPS, anti-IgM, or anti-CD40, and proliferation was assessed using CellTrace™ Violet labeling, gated on insulin-binding and non-insulin-binding B cells. (A) Dose responses to LPS, anti-IgM, and anti-CD40 were assessed for non-insulin-binding and insulin-binding using B cells purified from VH125SD.NOD mice. Mean response ± SEM is shown for each dose (n=5). (B, top panel) Representative dot plot illustrating proliferation in response to 10μg/ml LPS for non-insulin-binding B cells (blue) and insulin-binding B cells (red). Box designates proliferating cell populations. Cells were gated on B220+CD19+IgMa+ live lymphocytes. (B, bottom panel) Representative histogram showing proliferation peaks for non-insulin-binding cells (blue tinted background and line) compared to insulin-binding cells (red line) after stimulation with 10μg/ml anti-IgM. Cells were gated on B220+CD19+ live lymphocytes. (C) Summary of proliferative responses as assessed by percentage of dividing cells (top panel) and proliferation index calculated using FlowJo v10.2 software (bottom panel) of B cells purified from VH125SD.NOD mice (n ≥3) and cultured for 3.5 days with media alone (no stimulation), LPS, anti-IgM, anti-CD40, or anti-CD40 + IL-4 as a positive control. Closed and open histograms denote non-insulin-binding and insulin-binding B cell populations, respectively. Error bars denote SEM.

