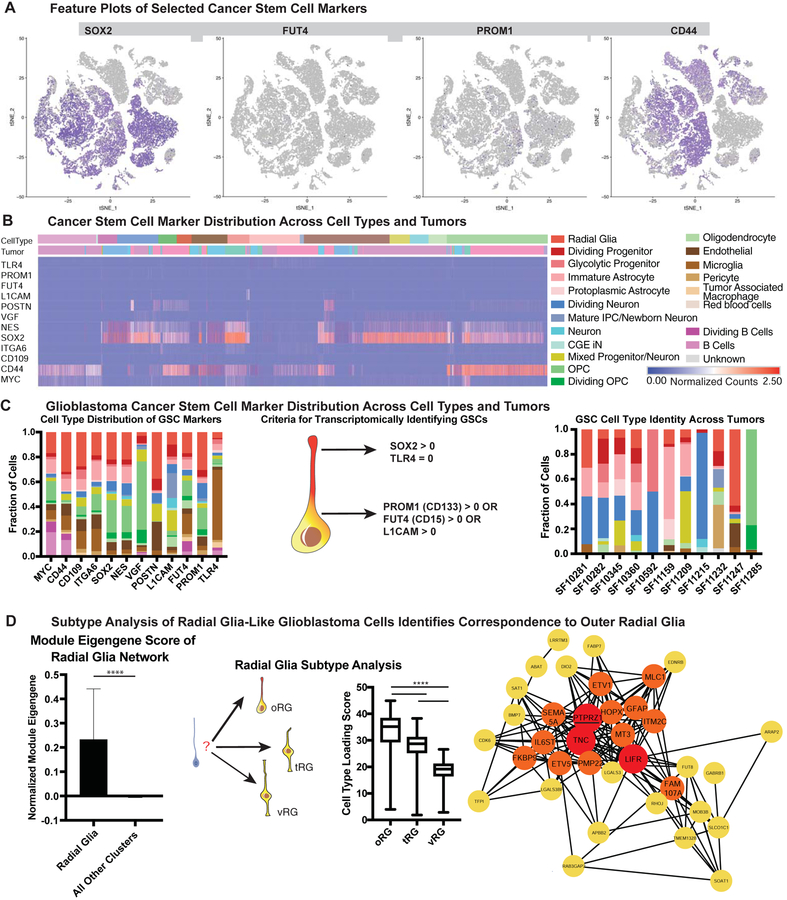
Figure 2. Glioblastoma Cancer Stem Markers are Expressed in a Variety of Cell Types.
a) Feature plots of selected cancer stem markers. Some stemness genes (such as SOX2 and CD44) are widely expressed, while others (such as PROM1 and FUT4) mark rare populations. b) Heatmap of normalized gene counts for glioblastoma cancer stem cell (GSC) markers with blue corresponding to no expression and red corresponding to 2.5 or more normalized counts within the cell. Many markers are co-expressed, and GSC markers span a variety of cell types (annotated above the heatmap). c) Fraction of cells annotated by cell type (based upon clustering analysis) that comprise GSC marker positive cells (based upon individual cell annotations), organized first by marker. Using markers that have been characterized in primary glioblastoma tumors and exist in tumor bulk populations, GSCs were identified for each tumor (based upon individual cell annotations). The heterogeneous composition of cell types for GSCs within a single is shown on the right. d) The expression of the radial glia gene signature was evaluated to be significantly higher in GBM radial glia-like cells compared to all other cell types (**** = p <0.0001, Student’s two sided t-test). GBM radial glia-like cells were compared to the known molecular signatures of radial glia subtypes. The arrows pointing to outer radial glia (oRG), truncated radial glia (tRG) and ventricular radial glia (vRG) are weighted in their thickness proportional to the relative correlation of GBM developmental radial glia-like cells to each subtype. The graph shows a significantly higher correlation (**** = p <0.0001, Student’s two sided t-test using all 32,000 cell observations) to oRG than to the other subtypes. Network diagram depicts the oRG network (Pollen et al 2015) that is highly correlated (R > 0.30) in GBM single-cell data. Red highlights nodes with > 20 connections, and orange highlights those with greater than 10 connections. The majority of genes in the developmental oRG network are preserved in GBM.

