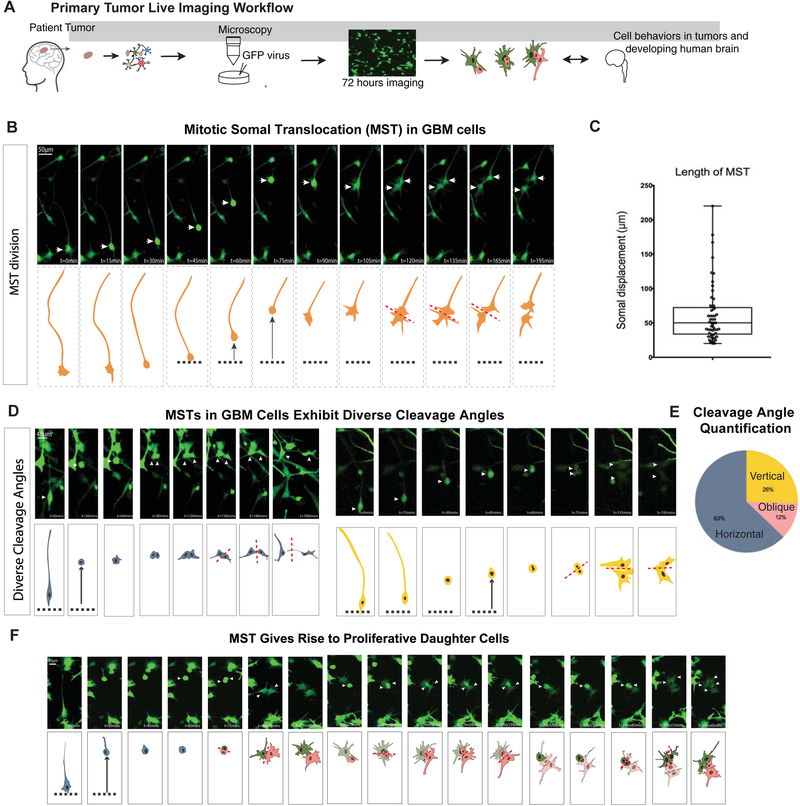
Figure 4. GBM oRG-like cells undergo mitotic somal translocation and can give rise to proliferative daughter cells.
a) Schematic of the workflow used to set up live imaging analysis of primary tumor resections. Tumors were dissociated and plated on Matrigel, after which they were infected with an adenovirus to express GFP. Live imaging was performed over the course of 72 hours. b) Still images of videos of time-lapse imaging depict a glioblastoma cell undergoing a mitotic somal translocation (MST) as seen by the translocation of the soma followed by cytokinesis. c) Box plot (min to max) shows the somal translocation distance in the observed MSTs. These distances and distribution are comparable to normal development. Distances calculated from 5 biological replicates and 3–8 imaging positions each. d) Another two examples of MST with the cleavage plane annotated to depict the different angles observed. e) Pie chart shows the proportion of horizontal, vertical, and oblique cleavage angles observed (relative to primary fiber) in live imaging analysis. 43 observations were analyzed across 5 biological replicates. f) Still images from live imaging analysis that identifies MST divisions giving rise to proliferative daughter cells in the same frame.

