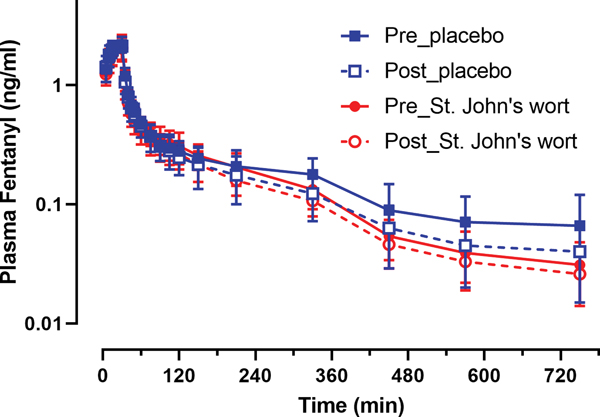
Figure 2.

plasma concentration time course of fentanyl in healthy human subjects following a 2.5 μg/kg intravenous infusion of fentanyl on pre- (closed symbol) and post- (open symbol) treatment days in the placebo (blue squares) or St. John’s wort (red circles) treatment groups (n = 8 in each). Results are the mean ± SD.
