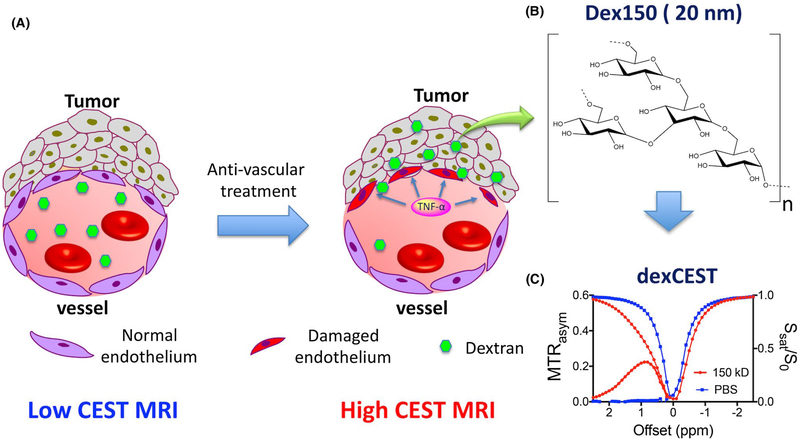
FIGURE 1.
Illustration of using dexCEST MRI to monitor the tumor responses to antivascular therapies. A, Schematic of the effect of antivascular therapies such as TNF-α on the extravasation of dextran molecules. The picture on the left shows a “normal” vessel around tumor cells, consisting of endothelial cells but lacking pericyte coverage. While it has greater permeability than healthy vessels, molecules larger than the pore size cannot easily pass. Upon TNF-α treatment, as shown in the picture on right, tumor endothelial cells are selectively damaged by TNF-α, resulting in an enormous augmentation of vessel permeability and strong extravasation of large molecules in the tumor. B, Chemical structure of Dex150. C, CEST characteristics of Dex150 in PBS as shown by the Z spectrum and MTRasym plot of 3.6 mg/mL mM Dex150 (20 mM per glucose unit or 24 μM per dextran molecule, in 10 mM PBS, pH = 7.3). CEST MRI was performed using a 4-s-long CW radiofrequency pulse (B1 = 3.6 μT) at 37°C

