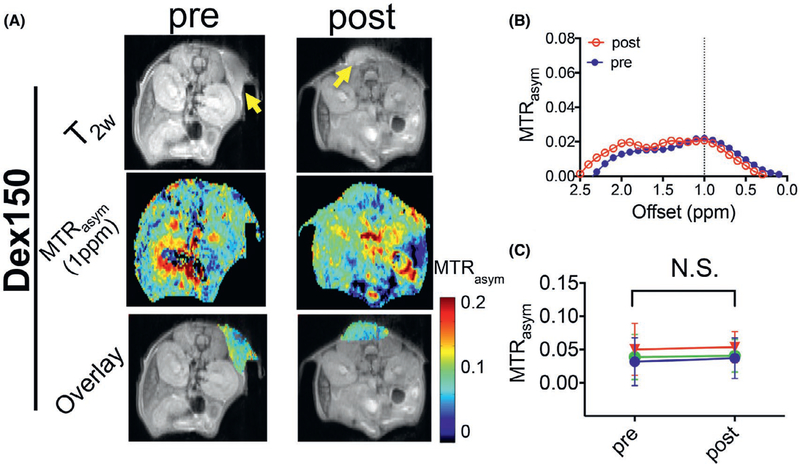
FIGURE 2.
DexCEST contrast enhancement in CT26 tumors before and 2 h after the administration of Dex150. A, From top to bottom, T2w anatomical images with tumors indicated by the yellow arrows (top), dexCEST parametric maps (middle), and overlaid images showing the dexCEST signal within the tumors (bottom) of the representative mice before and 2 h after the injection of Dex150. B, Corresponding MTRasym plots before and after injection. C, Mean pre- and post-dexCEST contrast in the tumors (n = 3)

