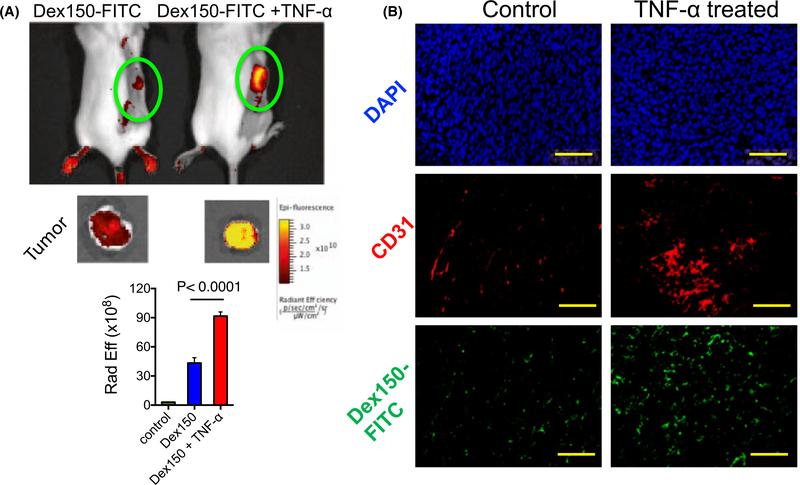
FIGURE 6.
Fluorescence validation. A, Fluorescence imaging of Dex150-FITC in the tumor. The top panel shows the images of 2 representative mice, with and without TNF-α treatment, respectively, at 2 h after Dex150-FITC injection; the middle panel is the corresponding ex vivo images of excised tumors; and the bottom panel is the bar plot of the average fluorescence intensities in the tumors receiving saline, Dex150 and Dex150+TNF-α, respectively. B, Fluorescence microscopic images of DAPI (top), CD31 (middle) and Dex150 (bottom), respectively

