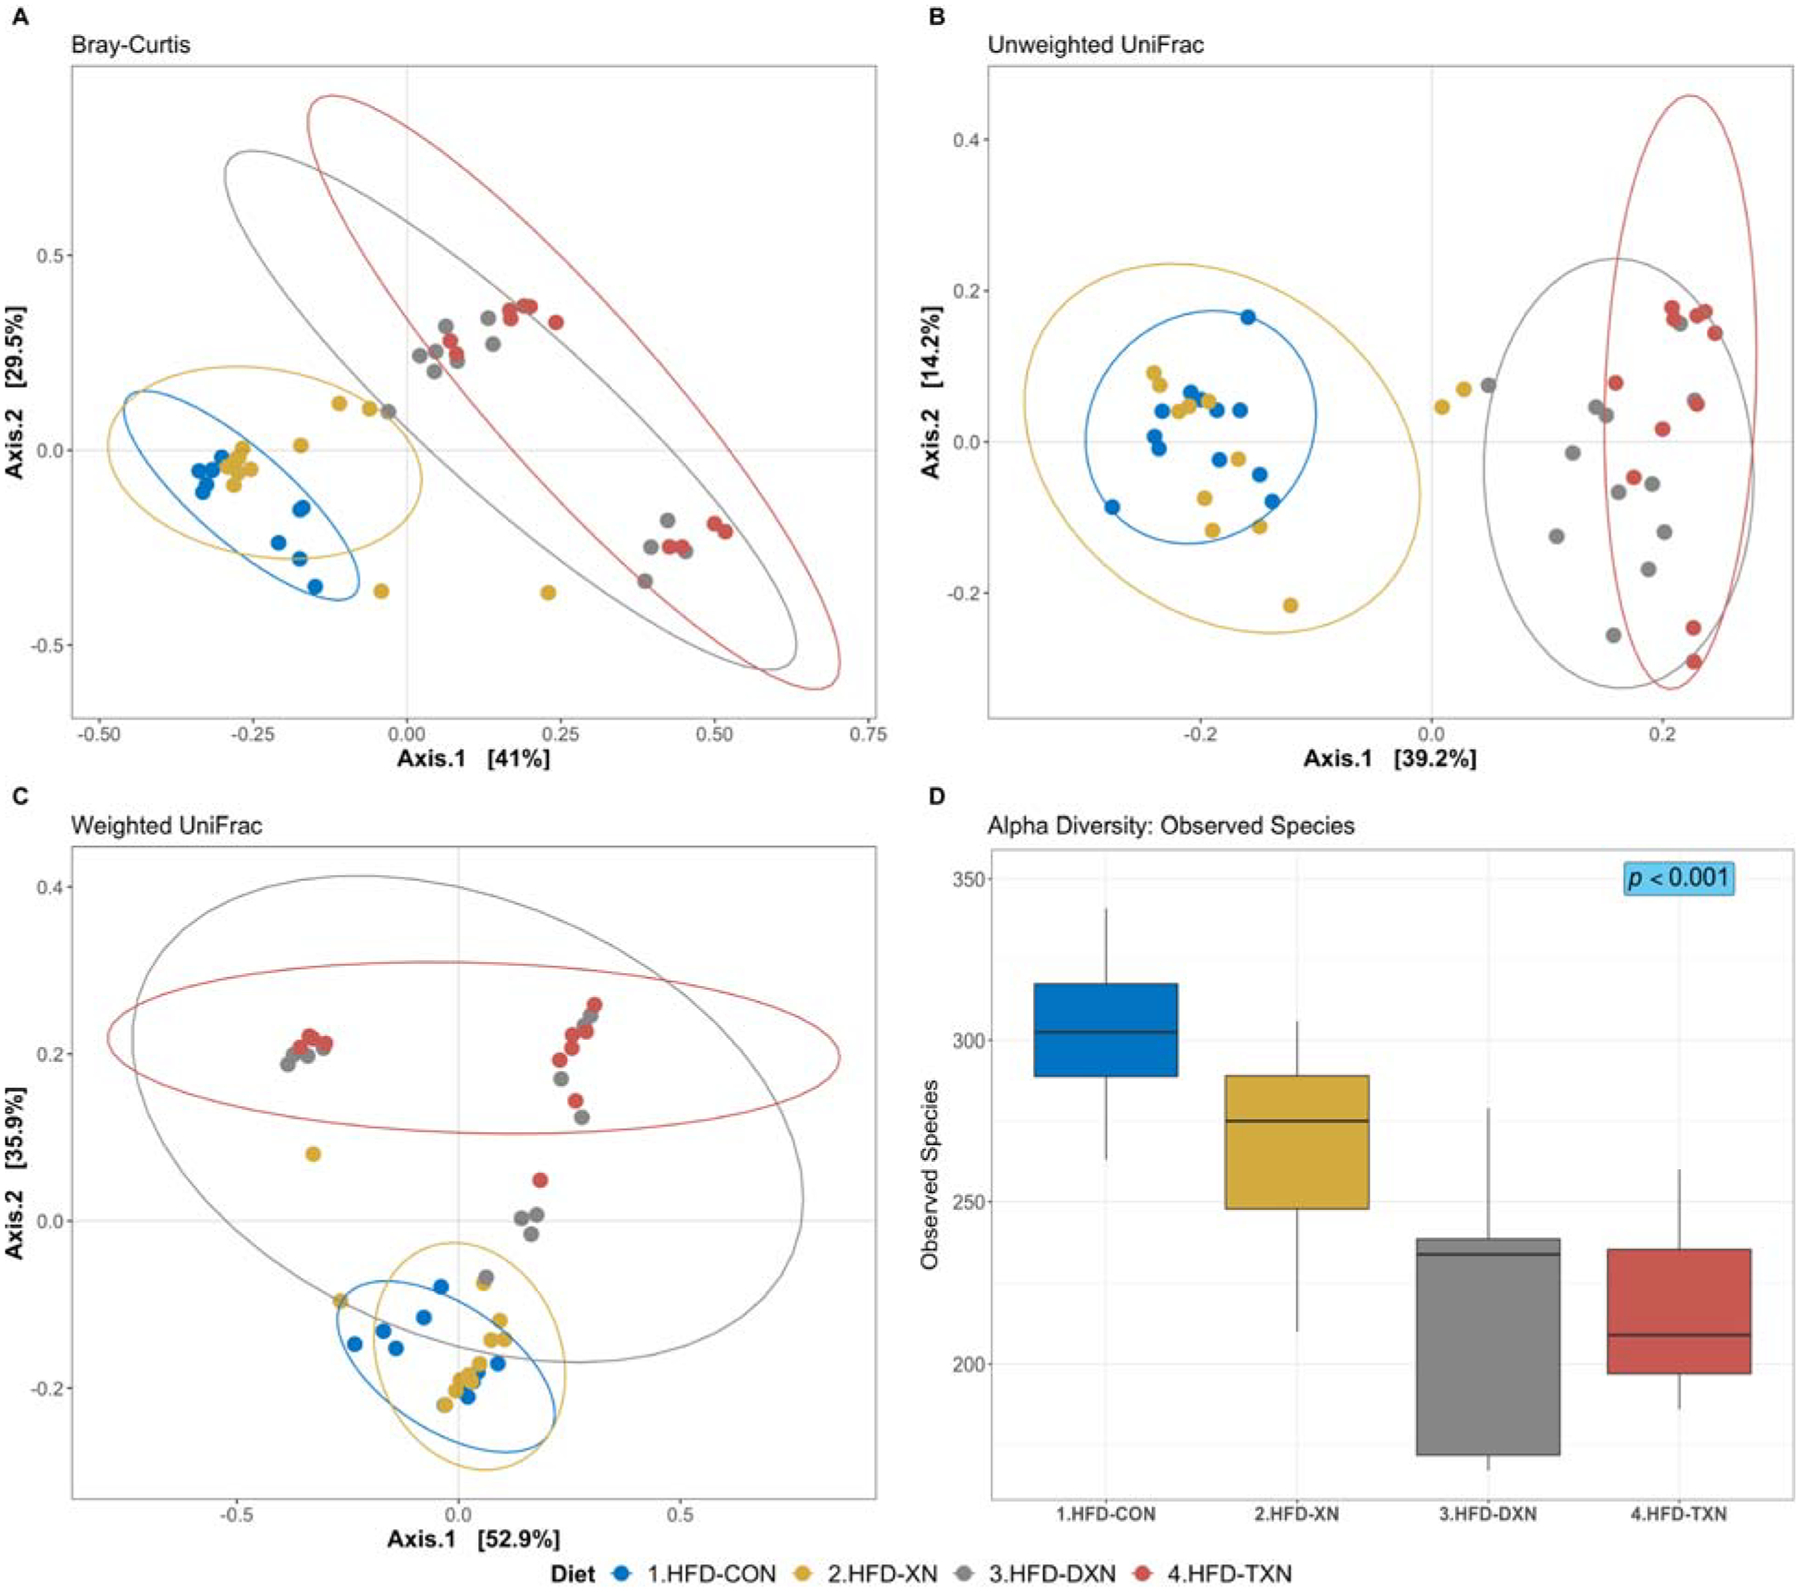
Figure 1. Principal coordinates analyses (PCoA) of gut microbiota based upon different distance matrices for the HFD-CON and HFD-XN, HFD-DXN and HFD-TXN supplementation.

Each point represents a mouse fecal sample, plotted by a principal component on the X-axis and another principal component on the Y-axis. The percentage on each axis indicates the contribution value to discrepancy among samples. (A) Bray-Curtis dissimilarity. (B) Unweighted UniFrac distance. (C) Weighted UniFrac distance. Ellipses are drawn at 0.95 C.I., t-distribution. Significant dissimilarity by dietary treatments across samples is observed. (ADONIS; adj-p = 0.001, R2 = 0.396; permutation = 999). (D) Alpha diversity index (observed species) was calculated on the rarefied ASV count data (chi-squared = 26.0, df = 3, p-value = 9.4 × 10⁻⁶; Kruskal-Wallis rank sum test). Metrics are plotted against HFD control and different xanthohumol treatments, i.e., XN, DXN, and TXN; with median (line), and hinges as first and third quartiles (25th and 75th percentiles).
