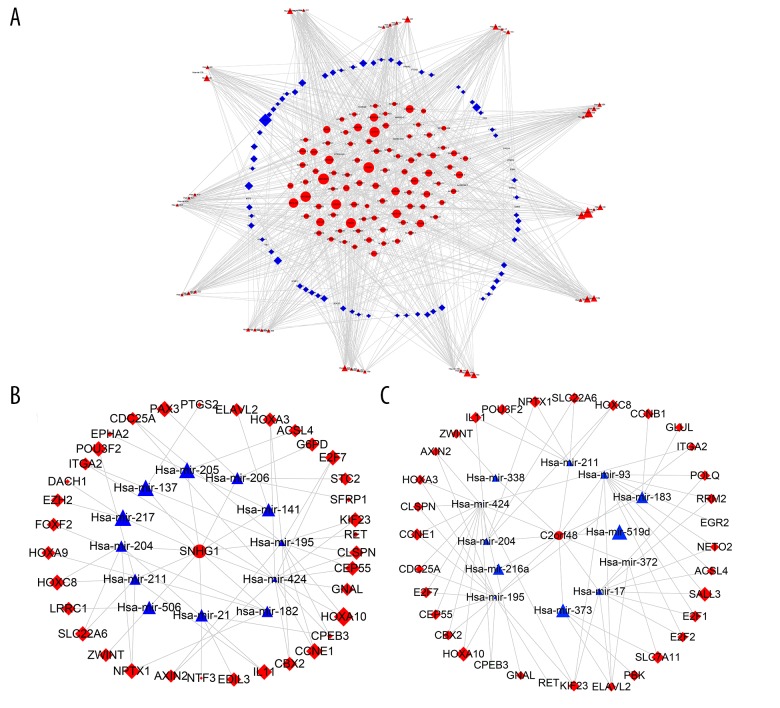
Figure 3.
lncRNA-miRNA-mRNA ceRNA regulatory network and sub-networks for liver cancer. (A) The ceRNA regulatory network. (B) SNHG1-centric ceRNA sub-network. (C) C2orf48-centric ceRNA sub-network. Oval represents lncRNAs, triangle stands for miRNAs and diamond denotes mRNAs. Red indicates upregulated genes and green represents downregulated genes.

