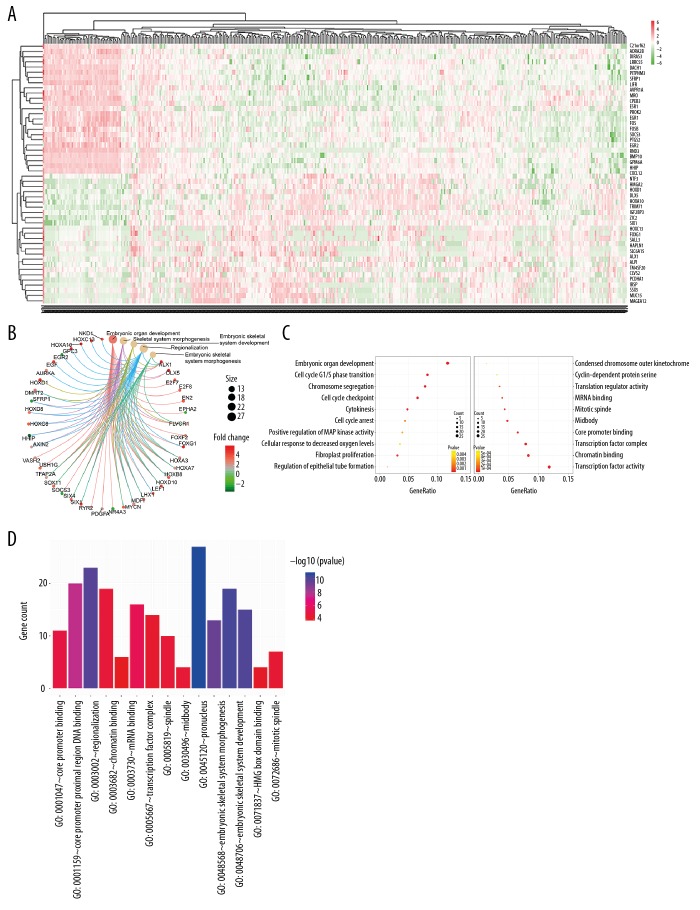
Figure 4.
GO analysis results. (A) The heat map showing the top 50 differentially expressed mRNAs with the largest fold change. (B) The top 5 GO terms enriched by differentially expressed mRNAs. Size of circle represents the number of enriched genes and the expression values are shown in line with the color scale. (C) The cellular component, molecular function, and biological process terms. (D) The top 5 cellular component, molecular function, and biological process terms. GO categories with p value <0.05 were considered statistically significant.

