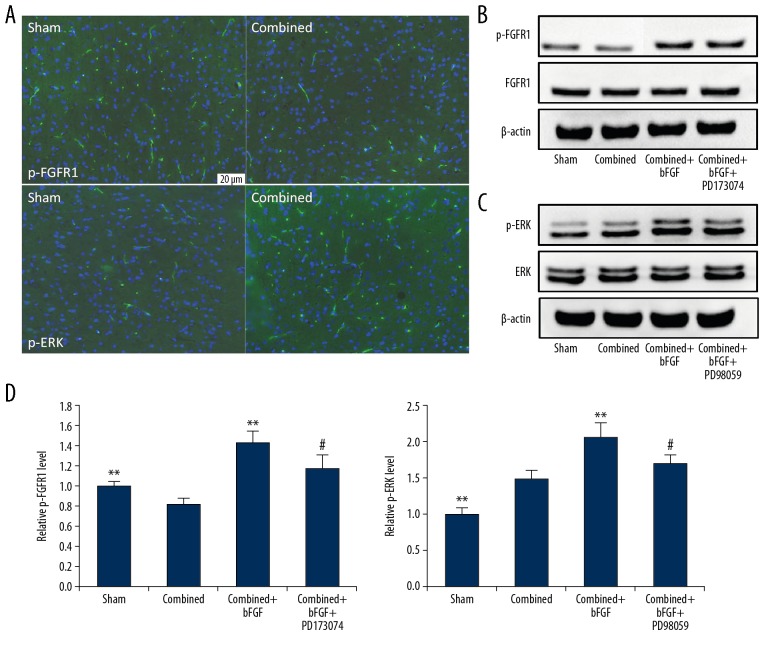
Figure 2.
Changes in p-FGFR1 and p-ERK expression in the brain microvascular endothelial cells of the blood–brain barrier (BBB). (A) Immunofluorescence staining of p-FGFR1 and p-ERK in the BBB; the expressions were changed after combined injury. (B) Representative image of a Western blot for FGFR1 and p-FGFR1. The expression of p-FGFR1 was affected by agonist (bFGF) and antagonist (PD173074). (C) Representative image of a Western blot for ERK and p-ERK. The expression of p-ERK was affected by agonist (bFGF) and antagonist (PD98059). (D) Quantification of data regarding expression of p-FGFR1 and p-ERK after treatment. ** P<0.01 Sham or combined+bFGF group vs. Combined group. # P<0.05 Combined+bFGF+PD173074 or Combined+bFGF+PD98059 group vs. Combined+bFGF group. Data are presented as the mean±SD.

