
Figure 2.
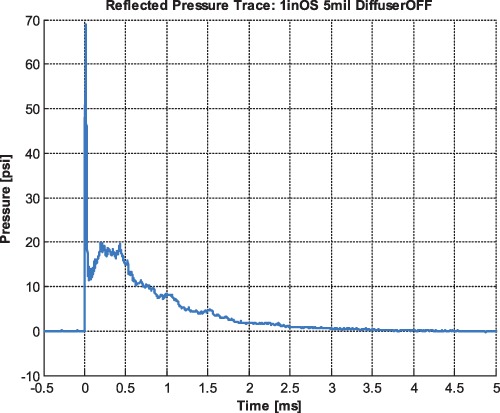
Pressure curve. During the experiment, the incident pressure is monitored with two sensors, one close at the entrance of the pressure wave into the shock tube, the other one close to the exit. The presented figure shows the reflected pressure, which is larger than the incident pressures and cannot be measured during the mouse experiment, but has to be determined in a separate experiment in the absence of the mouse. In the experiments presented here, the reflected pressure was 69 psi (shown), whereas the incident pressures (not shown) were approximately 34 and 27 psi.