
Figure 2. Bone Marrow Specimens.
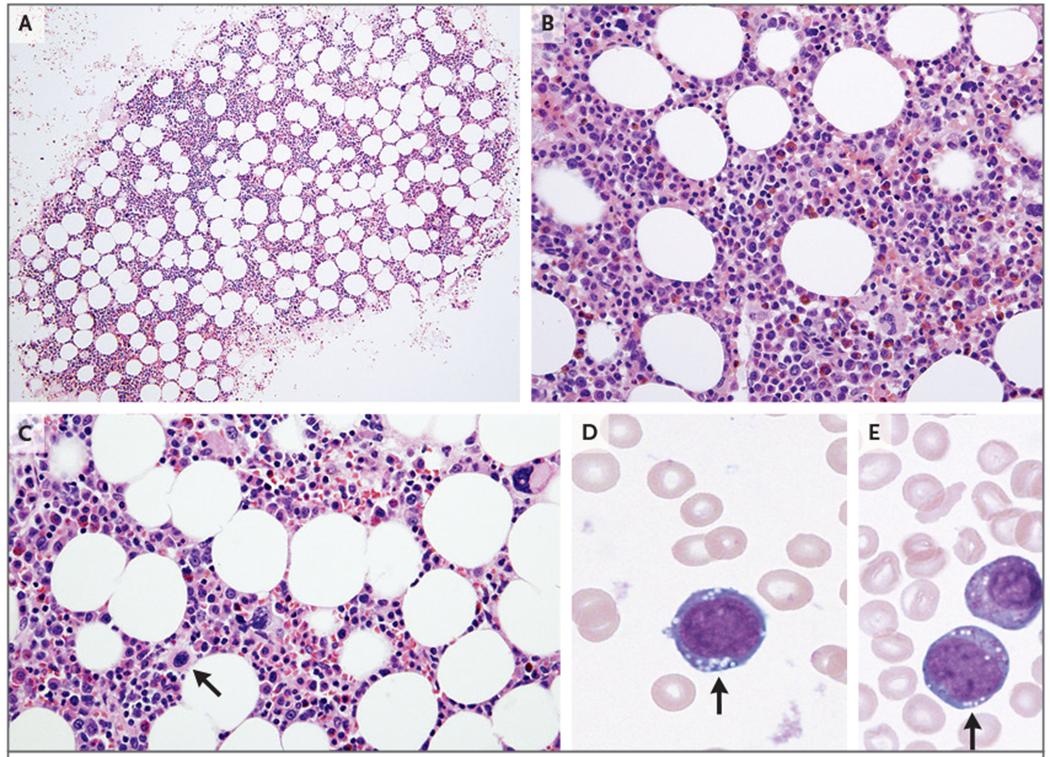
In Panel A, the core biopsy specimen shows 50% cellularity, normocellular to mildly hypercellular for the patient’s age. In Panel B, a high number of immature myeloid precursors with mild myeloid predominance and a relative decrease in erythroid maturation are noted. In Panel C, closer examination of the bone marrow core reveals atypical, small hypolobulated megakaryocytes (arrow) with a high nuclear-to-cytoplasmic ratio. In Panels D and E, cytoplasmic vacuoles (arrows) are noted in erythroid and myeloid precursors, respectively.