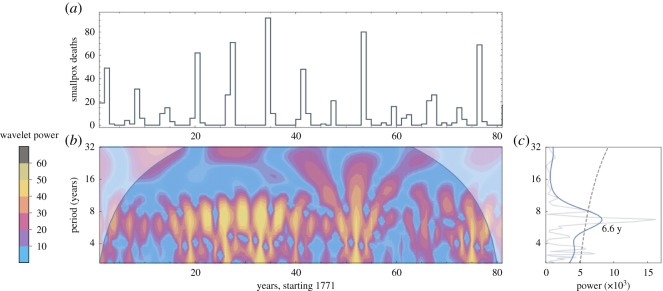
Figure 1.
Data for Hida, Japan. (a) Deaths per year, 1771–1852. (b) Derivative of Gaussian wavelet analysis of data in (a). The upper corner regions represent power outside the 95% confidence interval. (c) Thin grey line shows the Fourier spectrum; thick blue line shows the global wavelet spectrum; and black dashed line shows 95% confidence interval.

