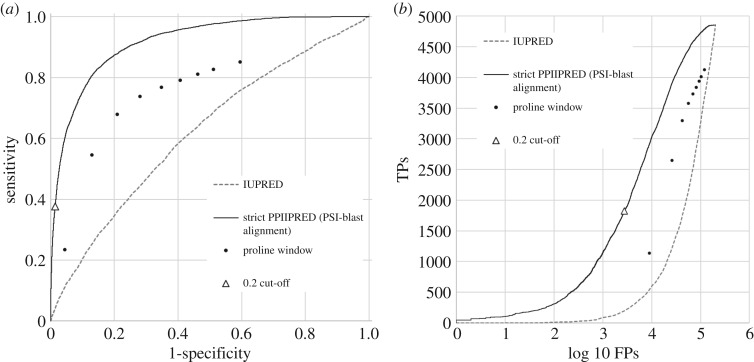
Figure 1.
Predictive performance of PPIIPRED. Solid Line: PPIIPRED predictions. Points: predictive power of the proportion of proline alone in windows defined on a residue including between 0 and 9 residues to either side (i.e. windows of 1 to 19 in size); dashed line: prediction based on disorder prediction alone (IUPRED); black: random expectation. The point on the PPIIPRED curve corresponding to a cut-off of 0.2 is highlighted to enable cross-referencing between the images. (a) ROC curve showing predictive performance on the test dataset at various cut-offs. (b) True positives versus log10 false positives.

