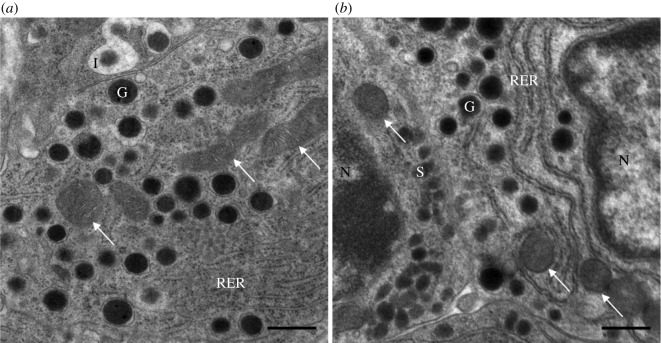
Figure 2.
Ultrastructure of α-cells under the electron microscope. Ultrathin section of the pancreatic endocrine cells: (a) control, well-developed mitochondria; (b) WD, a lower density of mitochondria, a less expressed matrix and a decreased number of cristae. G, glucagon granule; I, insulin granule; N, nucleus; RER, rough endoplasmic reticulum; S, somatostatin granule; the white arrows point on mitochondria. Scale bar, 500 nm.

