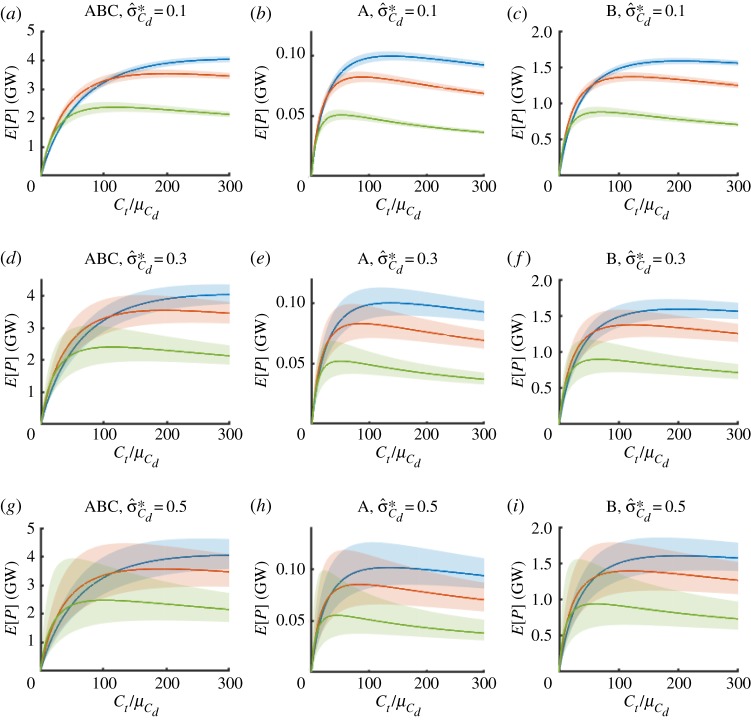
Figure 6.
Expected power removed and 90% confidence levels (shaded) in the fully spanned (a,d,g), asymmetrically confined (b,e,h) and laterally confined (c,f,i) fence deployment scenarios as a function of scaled turbine drag coefficient for different values of mean bed roughness coefficient (blue, red and green, respectively) and input relative standard deviation (top to bottom).

