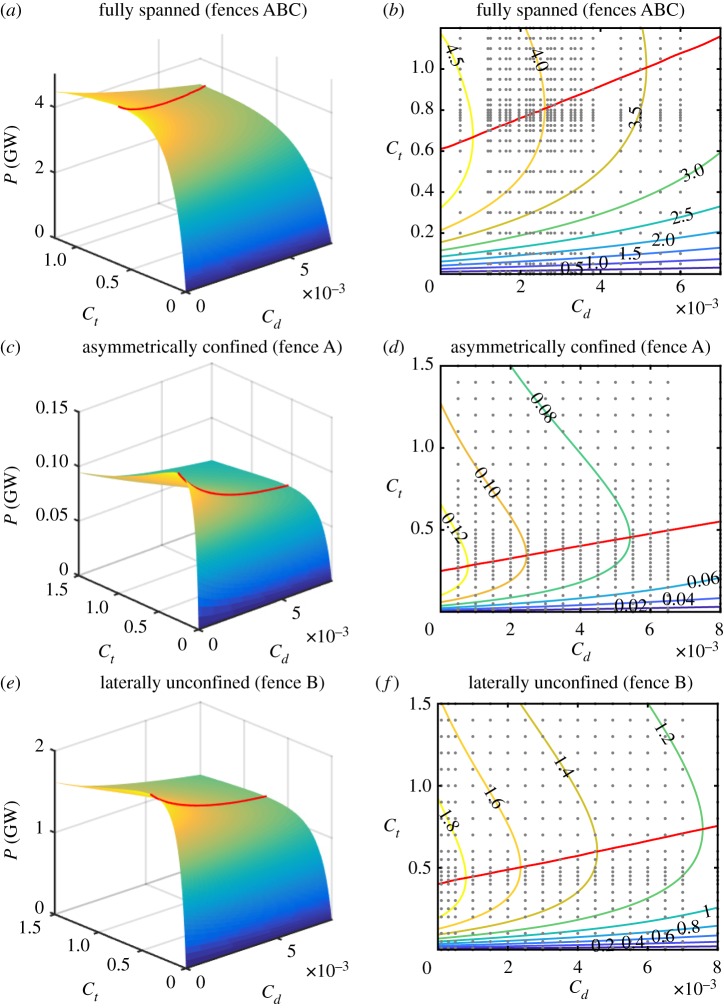
Figure 7.
Power extracted by fences ABC (a,b), fence A (c,d) and fence B (e,f) as a function of bed roughness coefficient Cd and turbine drag coefficient Ct. The red line indicates the location of maximum power dissipation. The input (Cd, Ct) values used to perform the numerical runs are indicated as grey points overlaid onto the contours.

