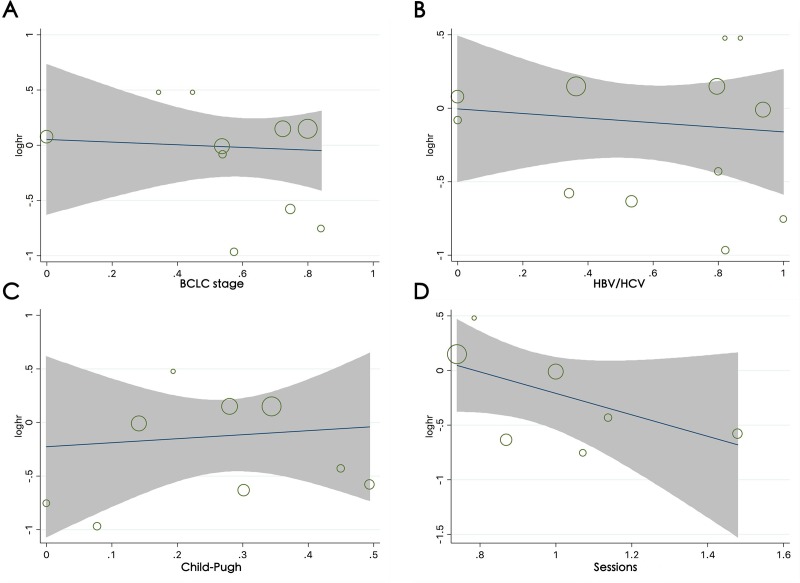
Fig 5. Meta-regression analysis for OS between DEB-TACE and cTACE.
Bubble plot with a fitted meta-regression line of the log HR for (A) the baseline proportion of BCLC-B/C, (B) the baseline proportion of HBV/HCV infection, (C) the baseline proportion of Child-Pugh classification A, (D) and the number of treatment sessions. The size of the circles is proportional to the weight of each study in the fitted random-effects meta-regression.

