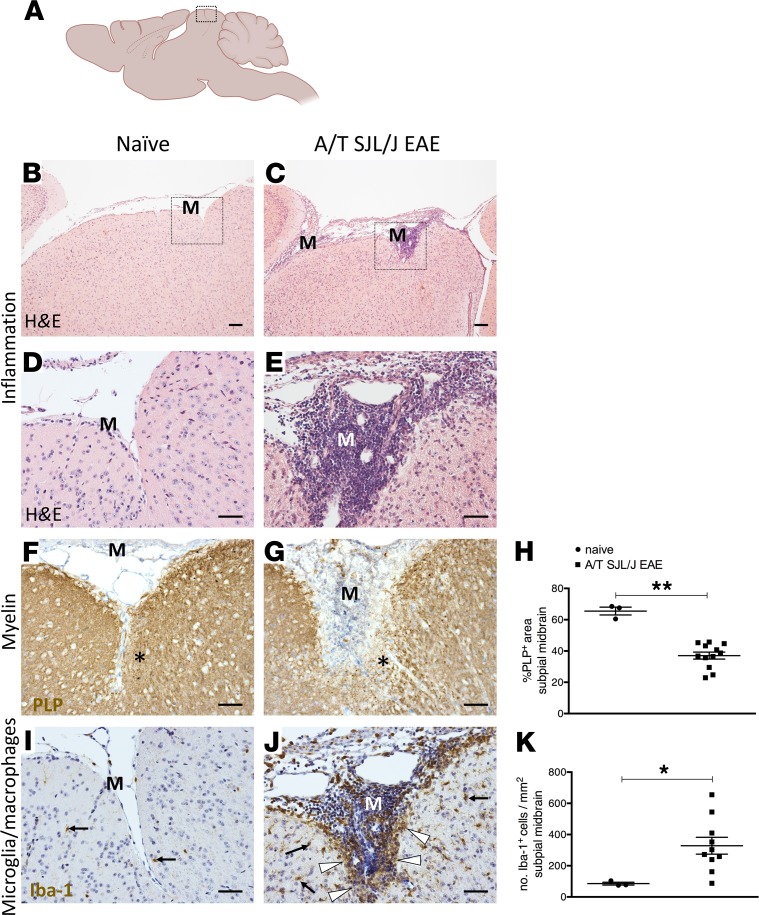
Figure 1. Meningeal inflammation in SJL/J adoptively transferred experimental autoimmune encephalomyelitis mice.
(A) Diagram of the mouse brain sectioned through the sagittal neuraxis, showing areas of the midbrain imaged in B–G, I, and J. (B–E) Assessment of meningeal inflammation by hematoxylin and eosin (HE) staining in naive mice (n = 3) (B and D) and in adoptively transferred SJL/J experimental autoimmune encephalomyelitis (A/T SJL/J EAE) mice at day 11 (acute phase; n = 12) (C and E). Boxes in B and C denote areas that are magnified in D and E. (F and G) Immunostaining for proteolipid protein (PLP), visualizing myelin, in the midbrain parenchyma adjacent to the meninges (M) in naive and A/T SJL/J EAE mice. In G, the asterisk indicates the area of subpial demyelination. (H) Quantitative analysis of the percentage of area covered by PLP staining in the subpial midbrain for each group. (I and J) Immunostaining for the ionized calcium binding adapter molecule 1 (Iba-1), a marker of microglia/macrophages in the midbrain parenchyma adjacent to the meninges in (I) naive and (J) A/T SJL/J EAE mice. In J, arrows highlight microglia/macrophages throughout the parenchyma. Arrowheads highlight aggregates of microglia/macrophages in proximity to the pia mater. (K) Quantitative analysis of the density of Iba-1+ cells in the subpial midbrain areas for each group. Values are shown as mean ± SEM. *P < 0.05, and **P < 0.01, Mann-Whitney U. Scale bars: 200 μm (B and C), 50 μm (I and J).

