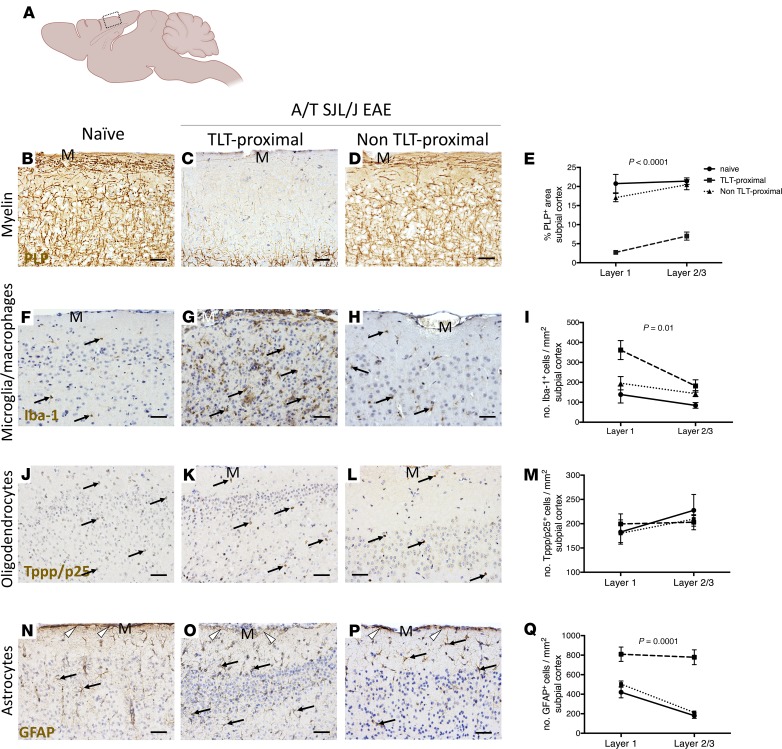
Figure 2. Meningeal inflammation is topographically related to a gradient of demyelination, reactive microglia/macrophages, and disruption of the glial limitans.
(A) Diagram of the mouse brain sectioned through the sagittal neuraxis, showing areas of the somatosensory cortex imaged and analyzed in B–Q. (B–E) Immunostaining and quantitative analysis for PLP in layers 1–3 of the somatosensory cortex of naive (n = 3) mice as well as TLT-proximal and non–TLT-proximal layers 1–3 of the somatosensory cortex of A/T SJL/J EAE (acute phase) mice (n = 12). (F–I) Immunostaining and quantitative analysis for Iba-1 in layers 1–3 of the somatosensory cortex of naive mice and TLT-proximal and non–TLT-proximal layers 1–3 of the somatosensory cortex of A/T SJL/J EAE (acute phase) mice. Arrows depict positive staining. (J–M) Immunostaining and quantitative analysis for the tubulin polymerization promoting protein (Tppp/p25) marker of myelinating oligodendrocytes in layers 1–3 of the somatosensory cortex of naive mice and TLT-proximal and non TLT-proximal layers 1–3 of the somatosensory cortex of A/T SJL/J EAE (acute phase) mice. Arrows depict positive staining. (N–Q) Immunostaining and quantitative analysis for the glial fibrillary acidic protein (GFAP) marker of astrocytes in layers 1–3 of the somatosensory cortex of naive mice and TLT-proximal and non TLT-proximal layers 1–3 of the somatosensory cortex of A/T SJL/J EAE (acute phase) mice. Arrows depict positive staining of astrocytes and arrowheads indicate glial limitans. For all quantifications, values are shown as mean ± SEM, and statistical significance was determined by 2-way ANOVA. M, meninges. Scale bars: 50 μm.

