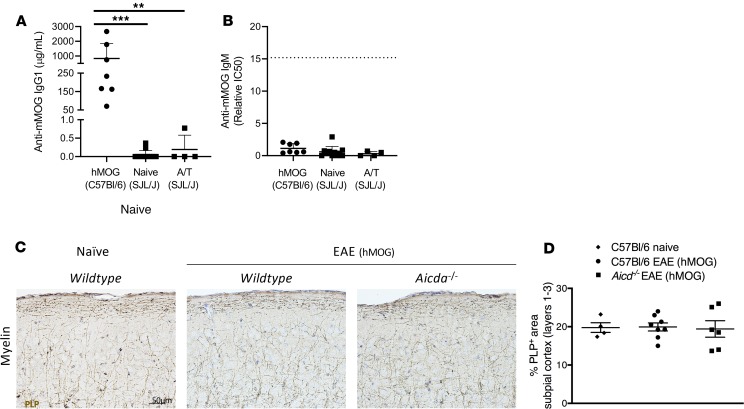
Figure 3. Alternative EAE models, with anti-MOG antibody production, do not produce significant cortical pathology.
ELISA was used to measure anti-mouse MOG IgG (A) and anti-mouse MOG IgM (B) in the blood. EAE was induced in C57BL/6 mice by immunization with hMOG and by adoptive transfer in SJL/J mice. (B) Anti-MOG IgM was quantified by comparing the IC50 of dilution curves (see Methods and Supplemental Figure 3). Sera from Aicda–/– mice immunized with hMOG were pooled to create a “standard” lot that was run as an internal control and is denoted by the dotted line. (C) Immunostaining and (D) quantitative analysis for PLP in layers 1–3 of the somatosensory cortex of naive wild-type (C57BL/6) mice (n = 4) and C57BL/6 (n = 8) or Aicda–/– mice (n = 6) immunized with hMOG. Values are shown as mean ± (A and B) SD or (D) SEM. Statistical significance for hMOG ELISAs was determined by Mann-Whitney U; **P < 0.01, and ***P < 0.0001. Statistical analysis for histology was done by Kruskal-Wallis with Dunn’s correction for multiple comparisons. Sera were collected from A/T SJL/J EAE mice on day 11 after adoptive transfer, and sera from hMOG mice were collected during the chronic phase of EAE. Scale bars: 50 μm.

