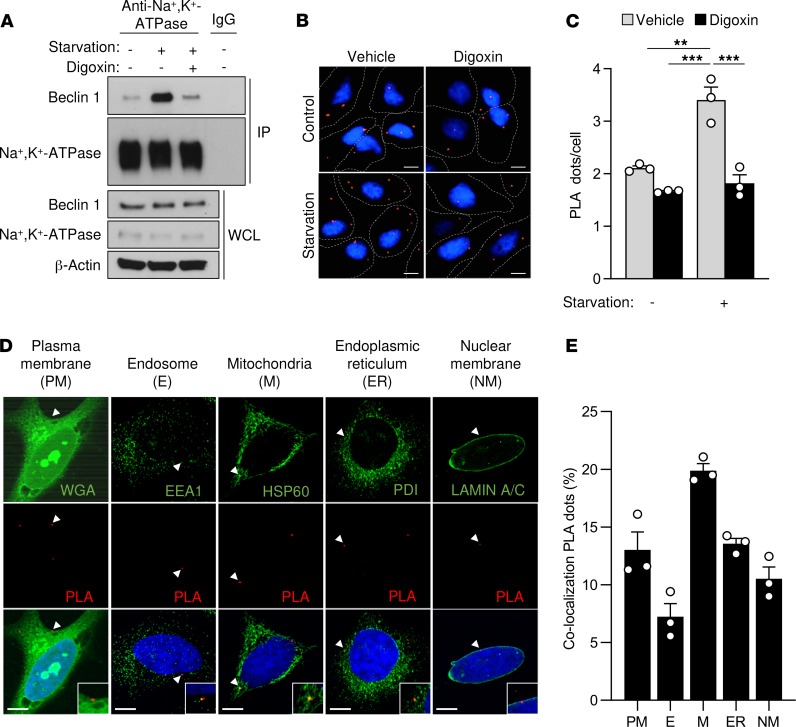
Figure 1. Beclin 1 and Na+,K+-ATPase interact in cultured cells during starvation.
(A) Coimmunoprecipitation of Beclin 1 with the α subunit of Na+,K+-ATPase in HeLa cells after 3 hours of growth in normal medium (–) or HBSS starvation medium (+) treated with either vehicle or 10 μM digoxin. The same lysate from cells grown in normal medium without digoxin (lane 1) was used as a control for IgG immunoprecipitation. Similar results were observed in 3 independent experiments. (B and C) Representative images (B) and quantitation (C) of proximity ligase assays (PLAs) of Beclin 1 and Na+,K+-ATPase in the indicated conditions. In C, bars represent mean values ± SEM from 3 independent experiments (value for each experiment represents mean value of at least 100 cells per condition). (D) Representative images of PLAs of Beclin 1 and Na+,K+-ATPase costained with markers of plasma membrane (wheat germ agglutinin, WGA), endosomes (EEA1), mitochondria (HSP60), endoplasmic reticulum (PDI), and nuclear membrane (LAMIN A/C) in HeLa cells after 3 hours of starvation. The insets represent a 2-fold enlargement of the area of interest in the original image. (E) Quantitation of the percentage of PLA dots that colocalize with each indicated organelle marker. Bars represent mean values ± SEM for 3 experiments (each value represents percentage of PLA dots at indicated organelle using total number of PLA dots in >100 cells analyzed as the denominator). WCL, whole-cell lysate. Scale bars: 10 μm. **P < 0.01, and ***P < 0.001, 2-way ANOVA (C).

