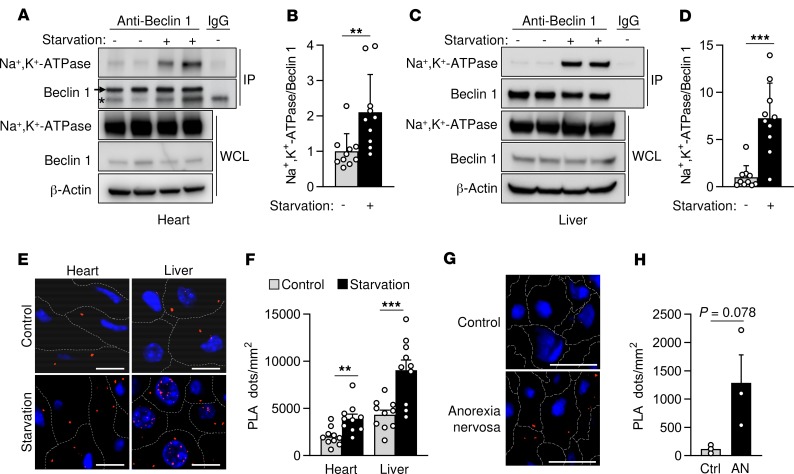
Figure 2. Beclin 1 and Na+,K+-ATPase interact in mouse and human tissues during starvation.
(A–D) Representative Western blots (A and C) and quantitation (B and D) of Na+,K+-ATPase coimmunoprecipitation with Beclin 1 from hearts (A and B) and livers (C and D) of mice after normal feeding or 48 hours of starvation. For A and C, the same tissue sample of the nonstarved group in lane 1 of the gel was used as a control for IgG immunoprecipitation. In B and D, bars represent mean ± SD (n = 10 mice). (E and F) Representative images (E) and quantitation (F) of proximity ligase assay of Beclin 1 and Na+,K+-ATPase in the indicated tissue and condition. For F, bars represent mean ± SEM (n = 10 mice, 10 randomly selected fields analyzed per mouse). (G and H) Representative images (G) and quantitation (H) of PLAs of Beclin 1 and the α subunit of Na+,K+-ATPase in livers from normal subjects (Ctrl) or patients with anorexia nervosa (AN). In H, bars represent mean ± SEM (n = 3 patients, at least 5 randomly selected fields analyzed per patient sample). Scale bars: 50 μm. Asterisk, nonspecific band. **P < 0.01, and ***P < 0.001, 2-tailed unpaired Student’s t test (B, D, F, and H).

