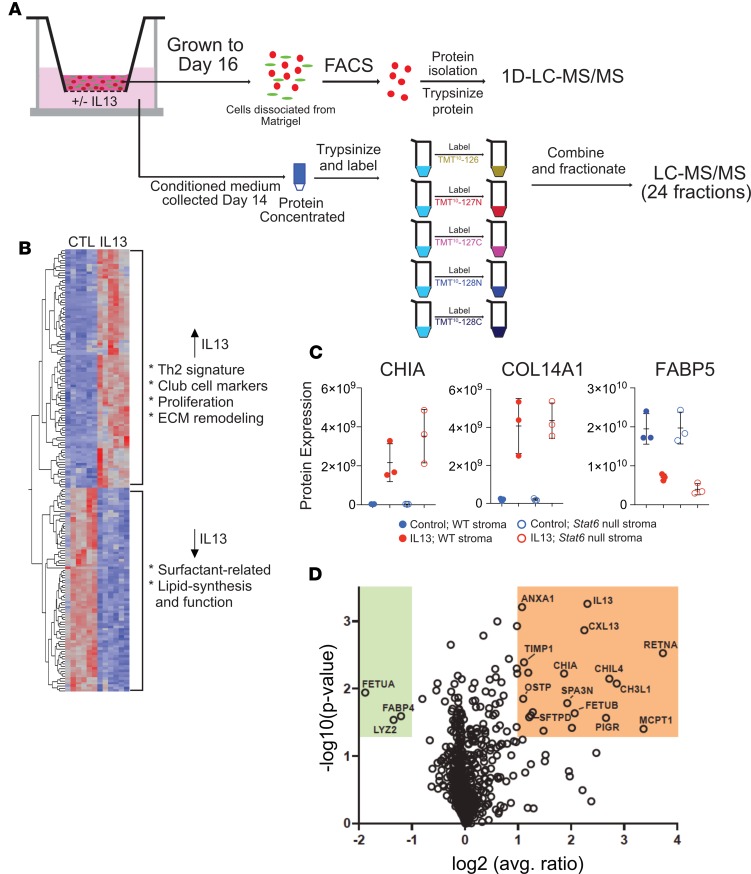
Figure 5. Proteomic analysis.
(A) Schematic. For cell-based proteomic analysis, lineage-labeled cells were dissociated from Matrigel, and protein isolated from them was trypsinized and peptides analyzed by nanoflow liquid chromatography–tandem mass spectrometry (nano–LC-MS/MS). For secretomic analysis, conditioned medium was collected at day 14 and protein trypsinized, labeled, fractionated, and analyzed by LC-MS/MS. (B) Heatmap showing differential expression of proteins in lineage-labeled epithelial cells from control and IL-13–exposed cultures. Proteins depicted are significant at P < 0.05 and fold change > ±1.5 in IL-13 vs. control. (C) Three representative differentially expressed proteins from cell-based proteomic analysis in B. Chitinase-like protein A (CHIA) and collagen α 1(XIV) chain (COL14A1) were significantly upregulated in AEC2-derived cells in IL-13–treated cultures compared with controls. Conversely, there was less expression of fatty acid binding protein 5 (FABP5) in AEC2-derived cells from IL-13–treated cultures compared with controls. CHIA WT, IL-13 vs. control, P = 0.001965; CHIA STAT6, IL-13 vs. control, P = 0.005662; COL14A1 WT, IL-13 vs. control, P = 0.011875; COL14A1 STAT6, IL-13 vs. control, P = 0.0.00319; FABP5 WT, IL-13 vs. control, P = 0.015991; FABP5 STAT6, IL-13 vs. control, P = 0.0.004382. *P < 0.05; **P < 0.005; paired, 2-tailed t test. (D) Volcano plot depicting proteins that are differentially expressed in the secretome of cultures treated with IL-13 versus control. Error bars represent mean ± SD. Analysis done with 3 biological replicates for each condition.

