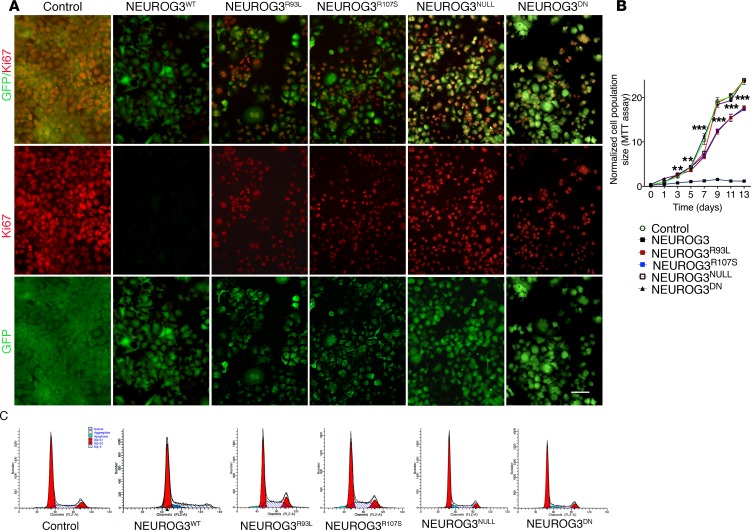
Figure 3. Proliferation of cells transduced with control or several NEUROG3 variants in BON4 cells.
(A) Representative images of GFP and Ki67 staining. Scale bar: 100 μm. (B) MTT analysis of cells transduced 5 days earlier with constitutively active lentiviruses expressing NEUROG3 variants. (C) Representative FACS analysis of cells transduced with the various lentiviruses performed on day 5. Shown are a representative histogram and the result of 3 separate experiments performed in triplicate. **P < 0.01, ***P < 0.005, 2-way ANOVA and 2-way Tukey’s multiple comparisons.

