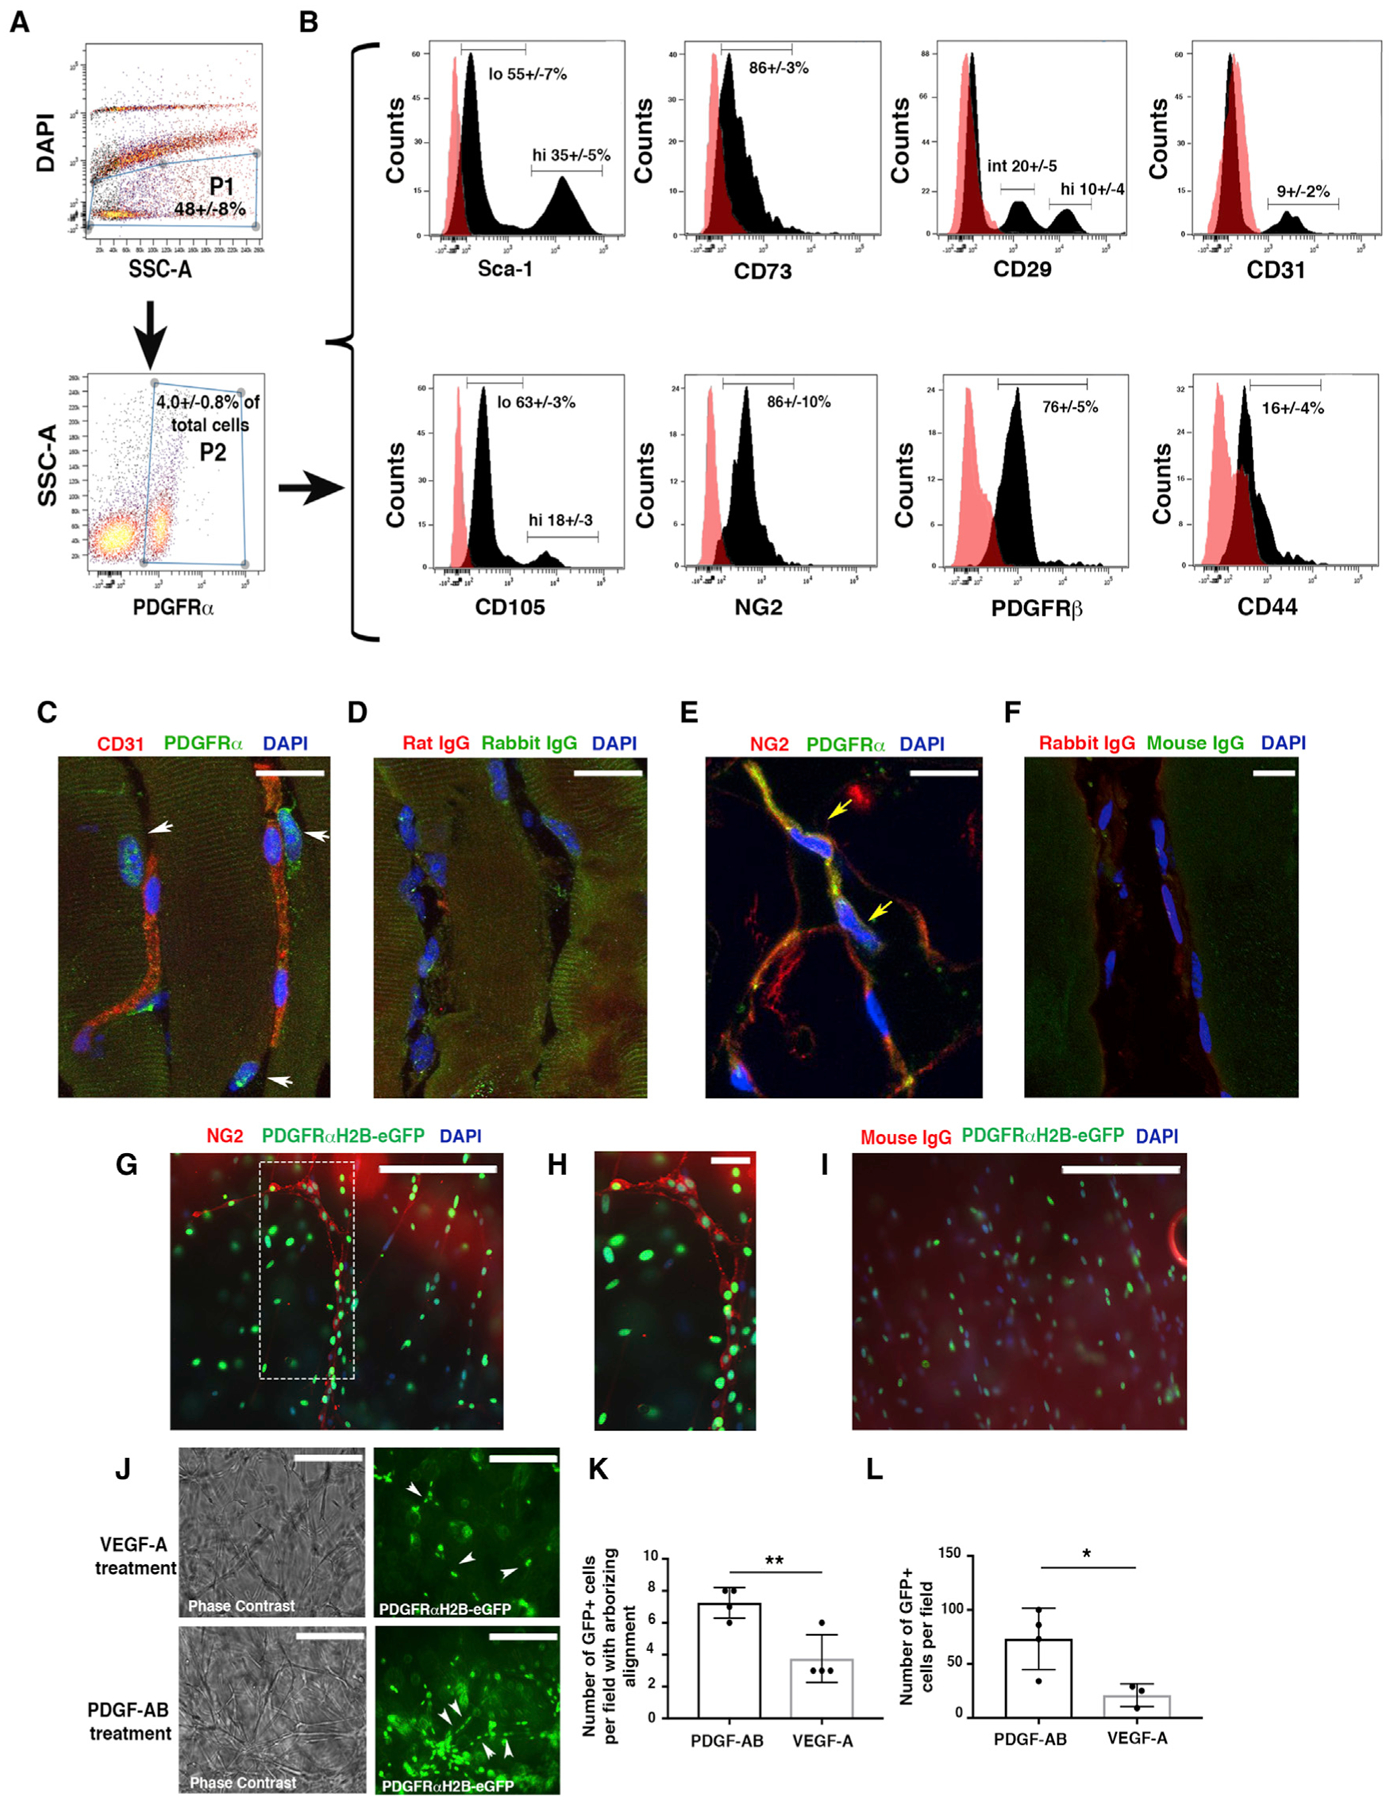
Figure 1. PDGFRα+ Cells Are Tissue-Resident Mesenchymal Cells.

(A) Flow cytometric analysis of PDGFRα+ cells from murine skeletal muscle obtained from wild-type (WT) mice at 10–12 weeks of age. Cells were labeled with allophycocyanin (APC)- and phycoerythrin (PE)-conjugated antibodies, then gated as the DAPI− population (P1) and then for PDGFRα+-APC antibody (P2).
(B) PDGFRα+ cells were analyzed for the expression of endothelial (CD31), mesenchymal (Sca1, CD73, CD105, CD29, CD44), and pericyte markers (NG2 and PDGFRβ) from n = 3 independent experiments. PDGFRα+Sca1+ and PDGFRα+CD105+ cells were present as high (hi)- and low (lo)-expression populations. An intermediate (int) population was detected for PDGFRα+CD29+ cells. As a control, PDGFRα+ cells were labeled with immunoglobulin G (IgG) isotype antibodies. Representative histograms (dark peaks) are overlaid with IgG isotype controls (pink peaks).
(C–F) Immunofluorescence staining of PDGFRα+ cells with anti-PDGFRα antibody and anti-CD31 (C) or anti-NG2 (E) antibodies in the skeletal muscle of 4-month-old uninjured mice. White arrows show PDGFRα+CD31− cells (C); yellow arrows show PDGFRα+NG2+ cells (E). (D) and (F) represent control IgG immunofluorescence images. Images acquired with a Leica SP5 DM confocal as merged z stacks. Scale bars, 20 μm.
(G) Thoracic aortas from 4-month-old PDGFRαH2B-eGfp mice were isolated, dissected to 1-mm slices (“rings”), and plated in Matrigel. GFP+ cell migration was monitored daily for 5 days with an EVOS AMG imaging system (Thermo Fisher Scientific). Vessel-like formation of PDGFRαH2B-eGfp+ cells was assessed after 5 days by staining with anti-NG2 antibody (red) and DAPI (blue). Scale bar, 200 μm.
(H) High-power magnification of the dashed rectangle in (G). Scale bar, 30 μm. Images acquired with an EVOS AMG imaging system (Thermo Fisher Scientific). Images are representative of n = 3 independent experiments.
(I) Control immunofluorescence analysis with rabbit IgG (DAKO) as primary antibody. Scale bar, 200 μm.
(J) Aortic sections were treated with serum free-EBM media (Lonza) supplemented with VEGF-A or PDGF-AB for 5 days. Images were acquired with an EVOS AMG cell imaging system and are representative of n = 3 independent experiments. White arrows show scattered (VEGF treatment) versus linear arborizing (PDGF-AB treatment) localization of PDGFRα+ cells. Scale bars, 200 μm.
(K) Quantification of PDGFRαH2B-eGfp+ cells aligned as linear arborizing tubule-like structures after aortic explant and treatment with PDGF-AB or VEGF-A for 5 days as detected in a field of 0.2 mm2. The graph shows the average of n = 4 independent experiments for both groups. Data represent means ± SDs and were calculated by Student’s t test. **p < 0.01.
(L) Quantification of PDGFRαH2B-eGfp+ cells migrating outward from explanted aortas. Cells were counted in a field of 0.2 mm2 in n = 4 independent experiments for PDGF-AB and n = 3 for VEGF-A. *p < 0.05. Data represent means ± SDs.
