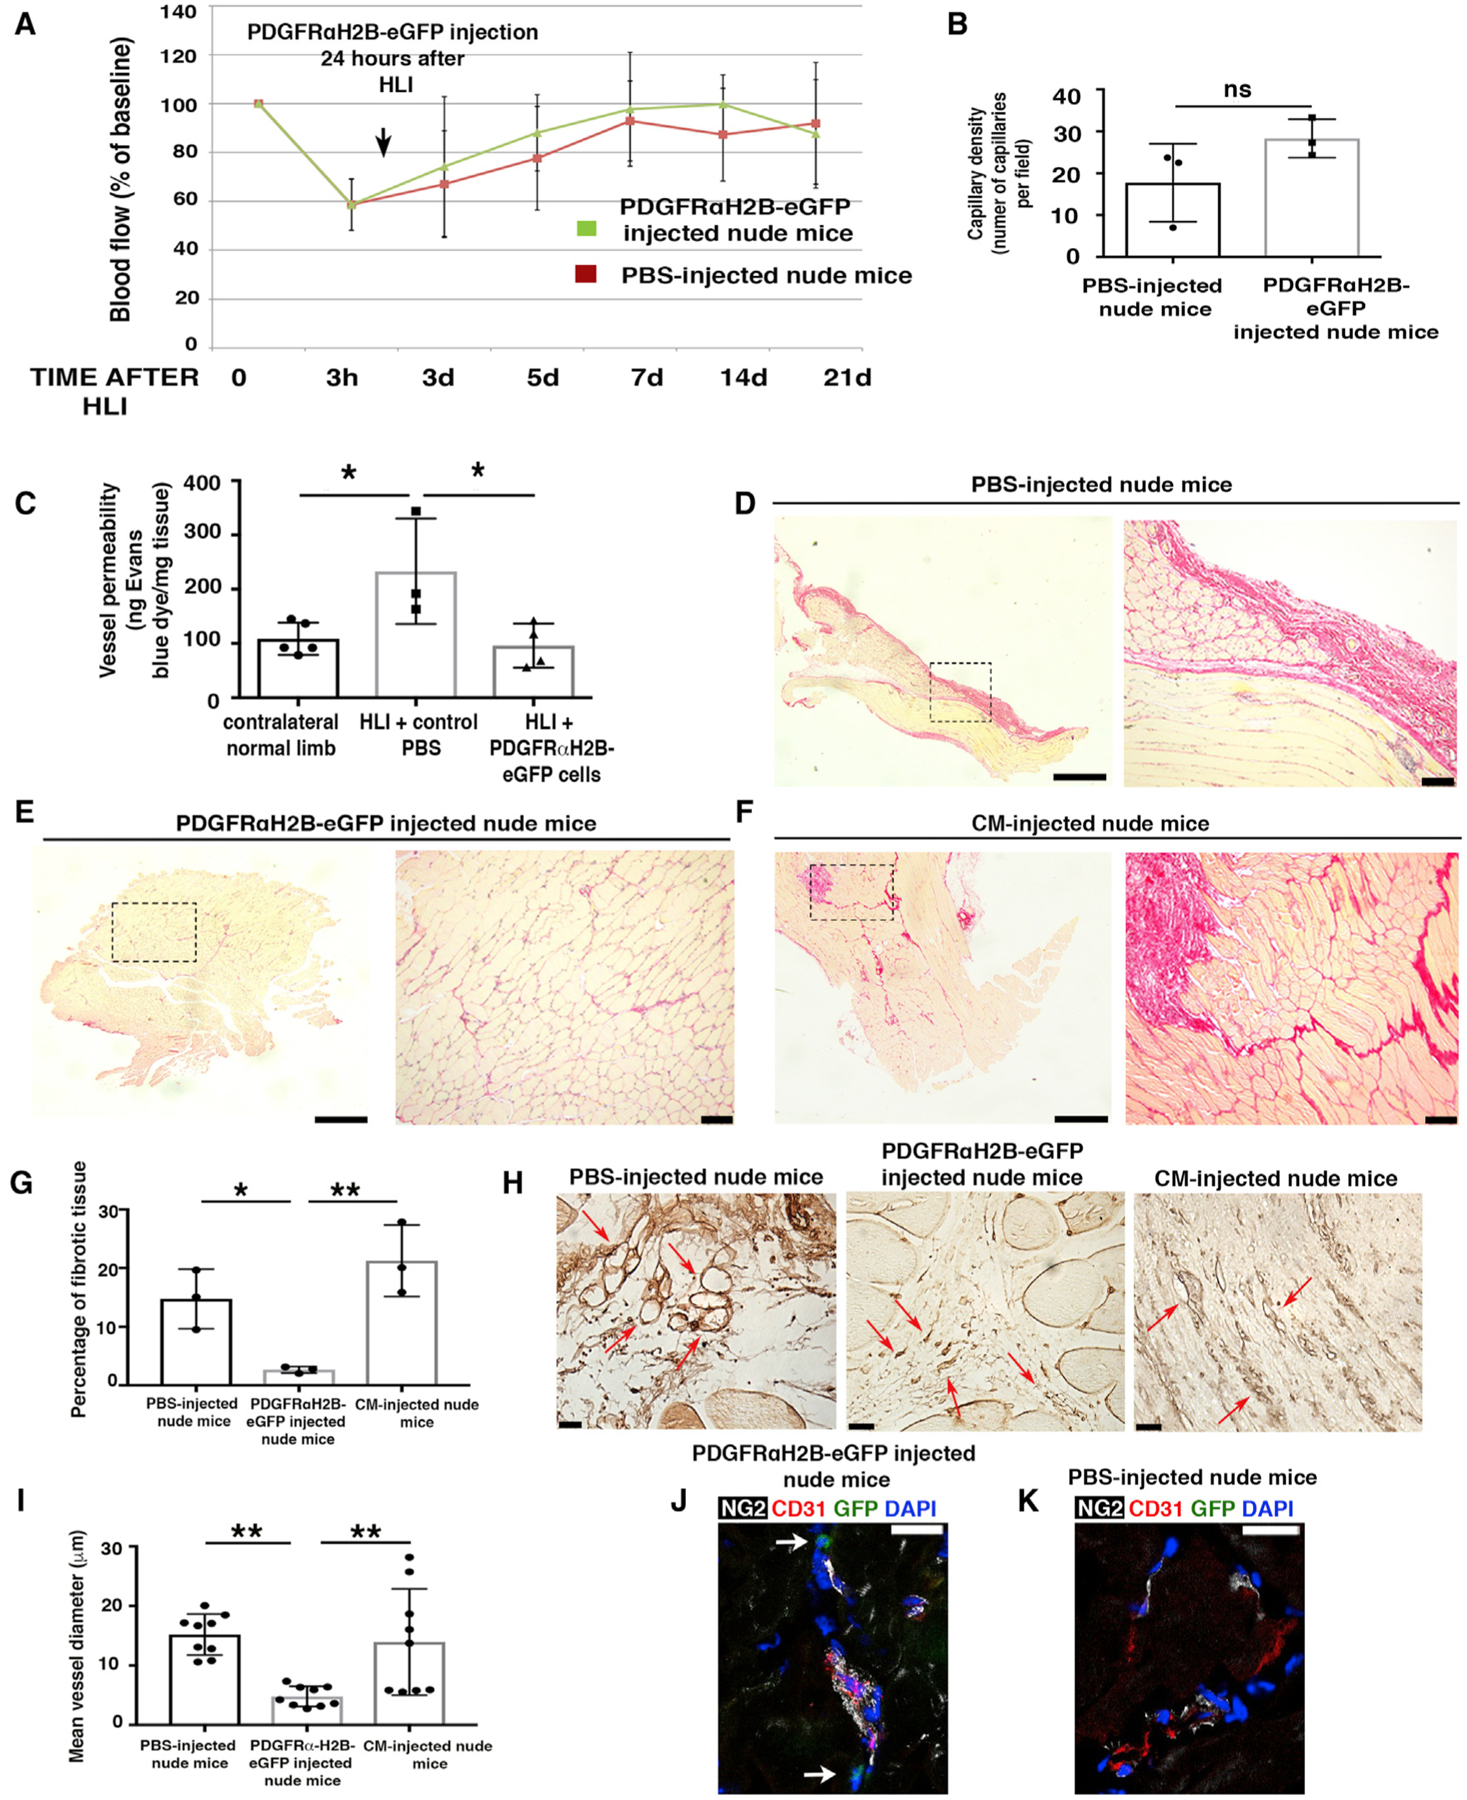
Figure 2. Undifferentiated PDGFRα+ Cells Promote Favorable In Vivo Tissue Revascularization and Healing.

(A) HLI was induced in 7-month-old female nude mice (athymic). Adoptive transfer by local injection of 2 × 10⁵ undifferentiated GFP+PDGFRα+ cells from 3-month-old male PDGFRαH2B-eGfp mice was performed 24 h after HLI induction. Blood flow was assessed as indicated in STAR Methods. Sixteen mice were analyzed at time 0 and after HLIs were divided randomly as control (PBS injected, n = 8) or cell-injected (n = 8) mice. Data represent means ± SDs and were analyzed by 1-way ANOVA and Tukey’s multiple comparison test. There were no differences between groups.
(B) Hindlimbs were harvested 21 days after HLI and sections were stained for isolectin B4 as described (Wen et al., 2005) and capillaries were counted in an area of 0.1 mm2 (capillary density). Groups were compared using Student’s t test (n = 3 independent experiments, p = 0.15). Data represent means ± SDs.
(C) Vessel permeability was assessed 21 days after HLI as reported (Radu and Chernoff, 2013). Values were normalized per milligram of tissue isolated. Groups were compared using 1-way ANOVA and Tukey’s multiple comparison test (n = 5 for contralateral normal limb, n = 3 for control PBS, and n = 4 for GFP+PDGFRα+ cells). Overall ANOVA p = 0.019. Data represent means ± SDs. Tukey’s post-test, *p < 0.05.
(D–F) Picrosirius red staining of skeletal muscle from PBS- (D), cell- (E), and conditioned media (CM)-injected (F) nude mice 21 days after HLI. Left panels are low magnification and dashed squares show where higher magnification (right panels) was acquired. Scale bars, 1 mm for left panels and 100 μm for right panels. Images representative of n = 3 independent experiments and were acquired with a Leica DMi8, Application Suite X, and a DCM2900 camera.
(G) Percentage of fibrotic tissue was calculated using ImageJ (NIH) and compared using 1-way ANOVA and Tukey’s multiple comparison test. *p < 0.05, **p < 0.01. Data represent means ± SDs.
(H) Isolectin B4 staining of PBS-, CM- and cell-injected ischemic adductor muscles 3 weeks after HLI. Red arrows show small and defined capillaries in mice injected with GFP+PDGFRα+ cells, whereas in control samples they were enlarged and appeared disorganized. Scale bars, 25 μm. Images acquired with a Leica DMi8, Application Suite X, and a DCM2900 camera.
(I) Average diameter of ~9 vessels measured in PBS-, CM- and cell-injected ischemic muscles. Quantification performed with ImageJ (n = 3 mice). **p < 0.01 and groups were compared using 1-way ANOVA and Tukey’s multiple comparison test. Data represent means ± SDs.
(J and K) Immunofluorescence analysis of GFP+PDGFRα+ (J) and PBS-injected (K) adductor muscles with antibodies against CD31 (red), NG2 (white), GFP+PDGFRα+ cells (green), and DAPI (blue). Scale bars, 20 μm. Images representative of n = 3 independent experiments. Images obtained with a confocal Leica SP5 DM as z stacks.
