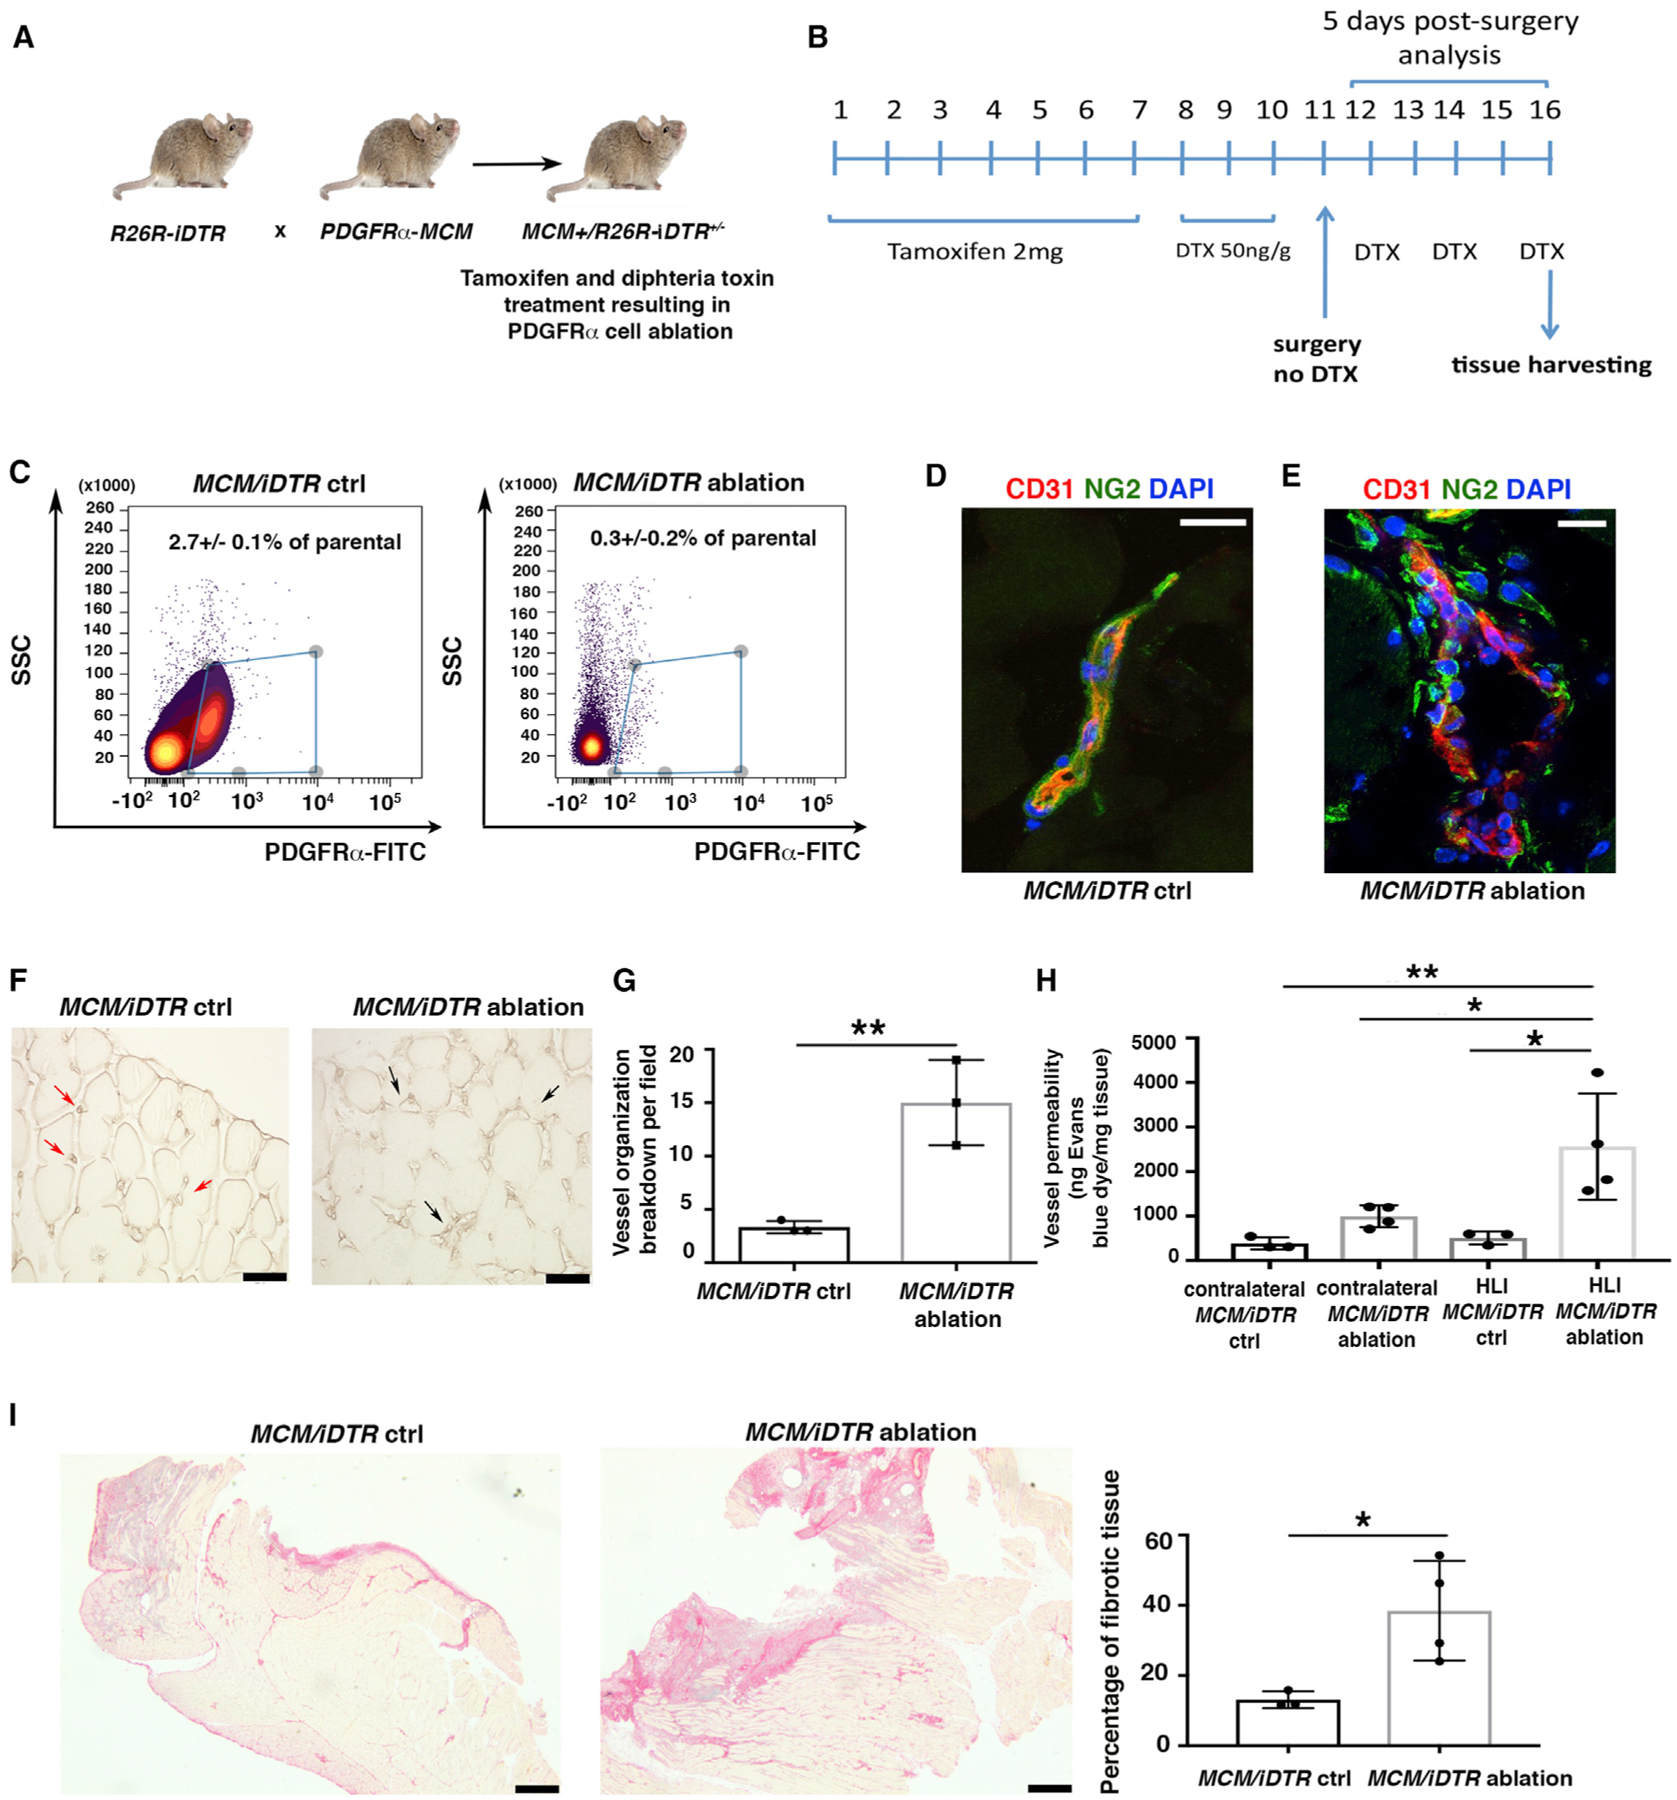
Figure 4. PDGFRα+ Cell Ablation Is Associated with Impaired Tissue Healing.

(A) Breeding strategy to generate R26R/iDTR mice harboring a knockin for CreER in the PDGFRα locus.
(B) To induce ablation, 3-month-old MCM+/iDTR+/− mice received tamoxifen and diphtheria toxin (DTX) as indicated.
(C) Flow cytometric analysis of whole hindlimb muscles to confirm cell ablation in MCM+/iDTR+/− mice treated with tamoxifen and DTX (MCM/iDTR ablation) versus peanut oil and DTX (MCM/iDTR control, ctrl) 5 days after HLI induction. PDGFRα+ cells were labeled with fluorescein isothiocyanate (FITC)-conjugated anti-PDGFRα antibody (1 μg/million cells). Data were analyzed using the Cytobank web application. Subsequently, each MCM/iDTR mouse was validated with flow cytometric analysis using a small piece of tissue, and only those with successful PDGFRα+ cell ablation were used for further experiments (see Figure S3A).
(D and E) Immunofluorescence analysis of MCM/iDTR ctrl (D) and ablated (E) adductor muscles with anti-CD31 (red) and anti-NG2 (green). Scale bars, 20 μm. Images representative of n = 3 independent experiments. Images obtained with a confocal Leica SP5 DM as z stacks.
(F) Isolectin B4 staining of MCM/iDTR ctrl and ablated adductor muscles. Red arrows show small and defined capillaries in the control sample, whereas black arrows show enlarged and disorganized capillaries in PDGFRα+ cell-ablated muscles. Scale bars, 50 μm. Images acquired with a Leica CTR 5500 microscope and DFC340FX camera.
(G) Vessel breakdown was counted in an area of 0.1 mm2, and the graph represents the average of n = 3 independent experiments. **p < 0.01. Data represent means ± SDs.
(H) Vessel permeability was assessed 5 days after HLI, as reported (Radu and Chernoff, 2013). Values were normalized per milligram of tissue isolated. Groups compared using 1-way ANOVA and Tukey’s multiple comparison test (n = 3 for control and n = 4 for ablated samples). Overall ANOVA p = 0.0051. Data represent means ± SDs. *p < 0.05, **p < 0.01.
(I) Picrosirius red staining of MCM/iDTR ctrl and ablated adductor muscles. Images representative of n = 3 independent experiments for MCM/iDTR ctrl and n = 4 for MCM/iDTR ablation. Right panel shows the quantification of the injured area, *p < 0.05. Data represent means ± SDs. Scale bar, 1 mm. Images acquired with a Leica DMi8, Application Suite X, and a DCM2900 camera.
