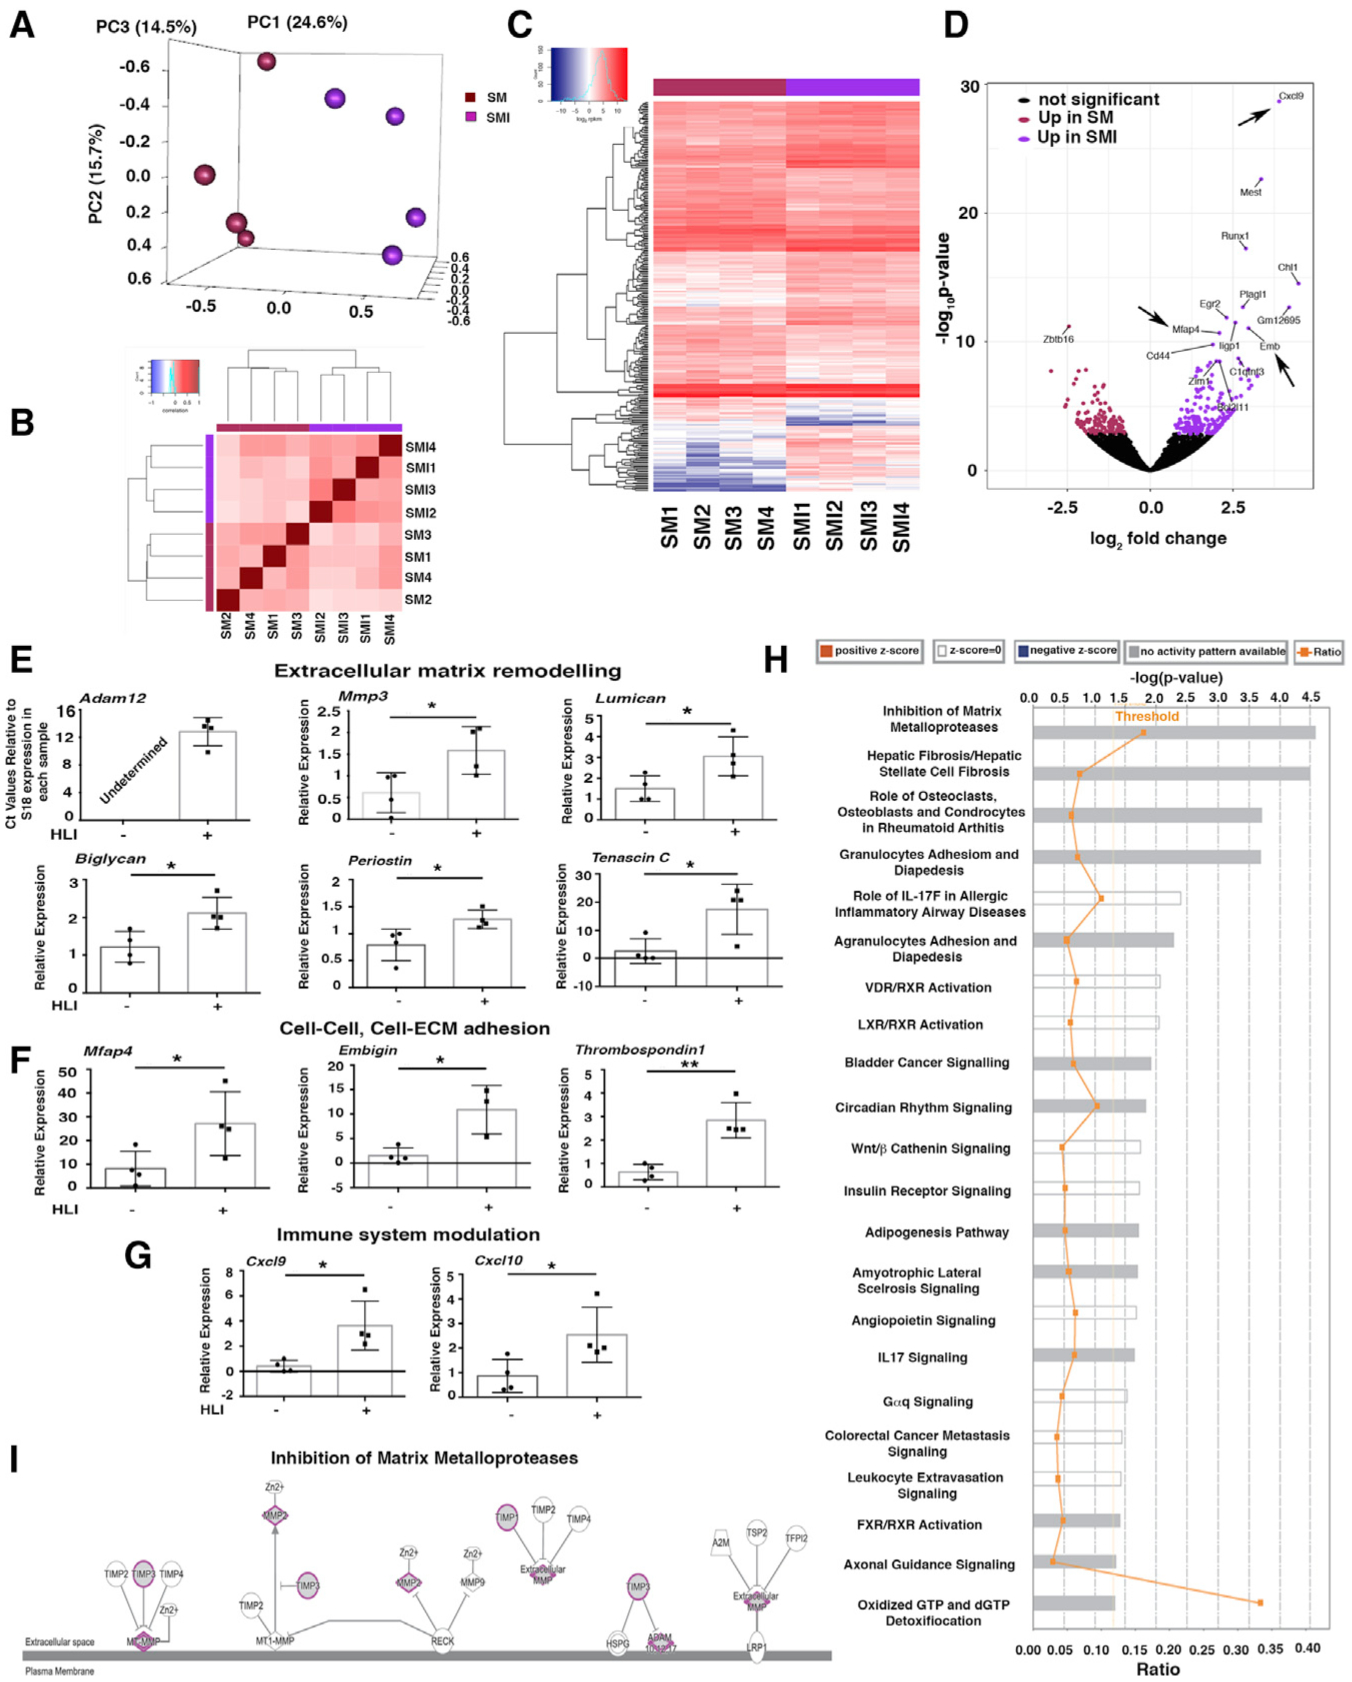
Figure 5. HLI Induces Pro-fibrotic and Pro-inflammatory PDGFRα+ Cell Activation.

(A) Principal-component analysis (PCA) using RNA-seq data from PDGFRα+ cells from uninjured skeletal muscle (SM) and 7 days after HLI induction (skeletal muscle injury [SMI]); n = 4 different samples for both SM and SMI.
(B) Block diagonal heatmap of PDGFRα+ cells from SM and SMI showing clustering among the analyzed populations.
(C) Heatmap analysis and dendrogram of differential gene expression comparing PDGFRα+ cells from SM and SMI mice.
(D) Volcano plot showing differentially expressed genes in PDGFRα+ cells comparing SM versus SMI (300 genes had significantly different expressions). Arrows indicate upregulated genes in the inflammatory response and cell-cell, cell-ECM adhesion group.
(E–G) Quantitative real-time PCR validation of key differentially expressed transcripts for SM versus SMI PDGFRα+ cell populations, as identified by RNA-seq, using Taqman probes (Thermo Fisher Scientific) that are specific for the indicated genes. Transcripts are grouped according to their role in ECM remodeling (E), in cell-ECM and cell-cell adhesion (F), and immune modulation (G). Samples were normalized against 18S RNA levels and Student’s t test was performed. *p < 0.05, **p < 0.01. In detail: panels in (E): n = 4 for mmp3, p = 0.035; lumican, p = 0.032; biglycan, p = 0.02; periostin, p = 0.03; tenascin C, p = 0.02. Adam12 was not detected in SM PDGFRα+ cells. In (F), panels show n = 4 for mfap4, p = 0.04; embigin, p = 0.014; thrombospondin 1, p = 0.0018. In (G), panels show n = 4 for cxcl9, p = 0.017; cxcl10, p = 0.04. Data represent means ± SDs.
(H) Canonical pathways identified by Ingenuity Pathway Analysis (IPA; Ingenuity Systems, https://www.ingenuity.com) for SM versus SMI PDGFRα+ cells. Significance is expressed as p value. Bars correspond to the top 22 canonical pathways that surpassed the IPA statistical threshold. Orange squares represent the ratio value for each canonical pathway.
(I) The top IPA pathway of SM versus SMI PDGFRα+ cells (by p value) was “inhibition of matrix metalloproteases.” Genes/proteins are illustrated as nodes and molecular relations as connecting lines between nodes (direct relations as normal lines; indirect relations as dashed lines), with those highlighted (purple outline, gray fill) being differentially expressed between SM and SMI PDGFRα+ cell populations.
