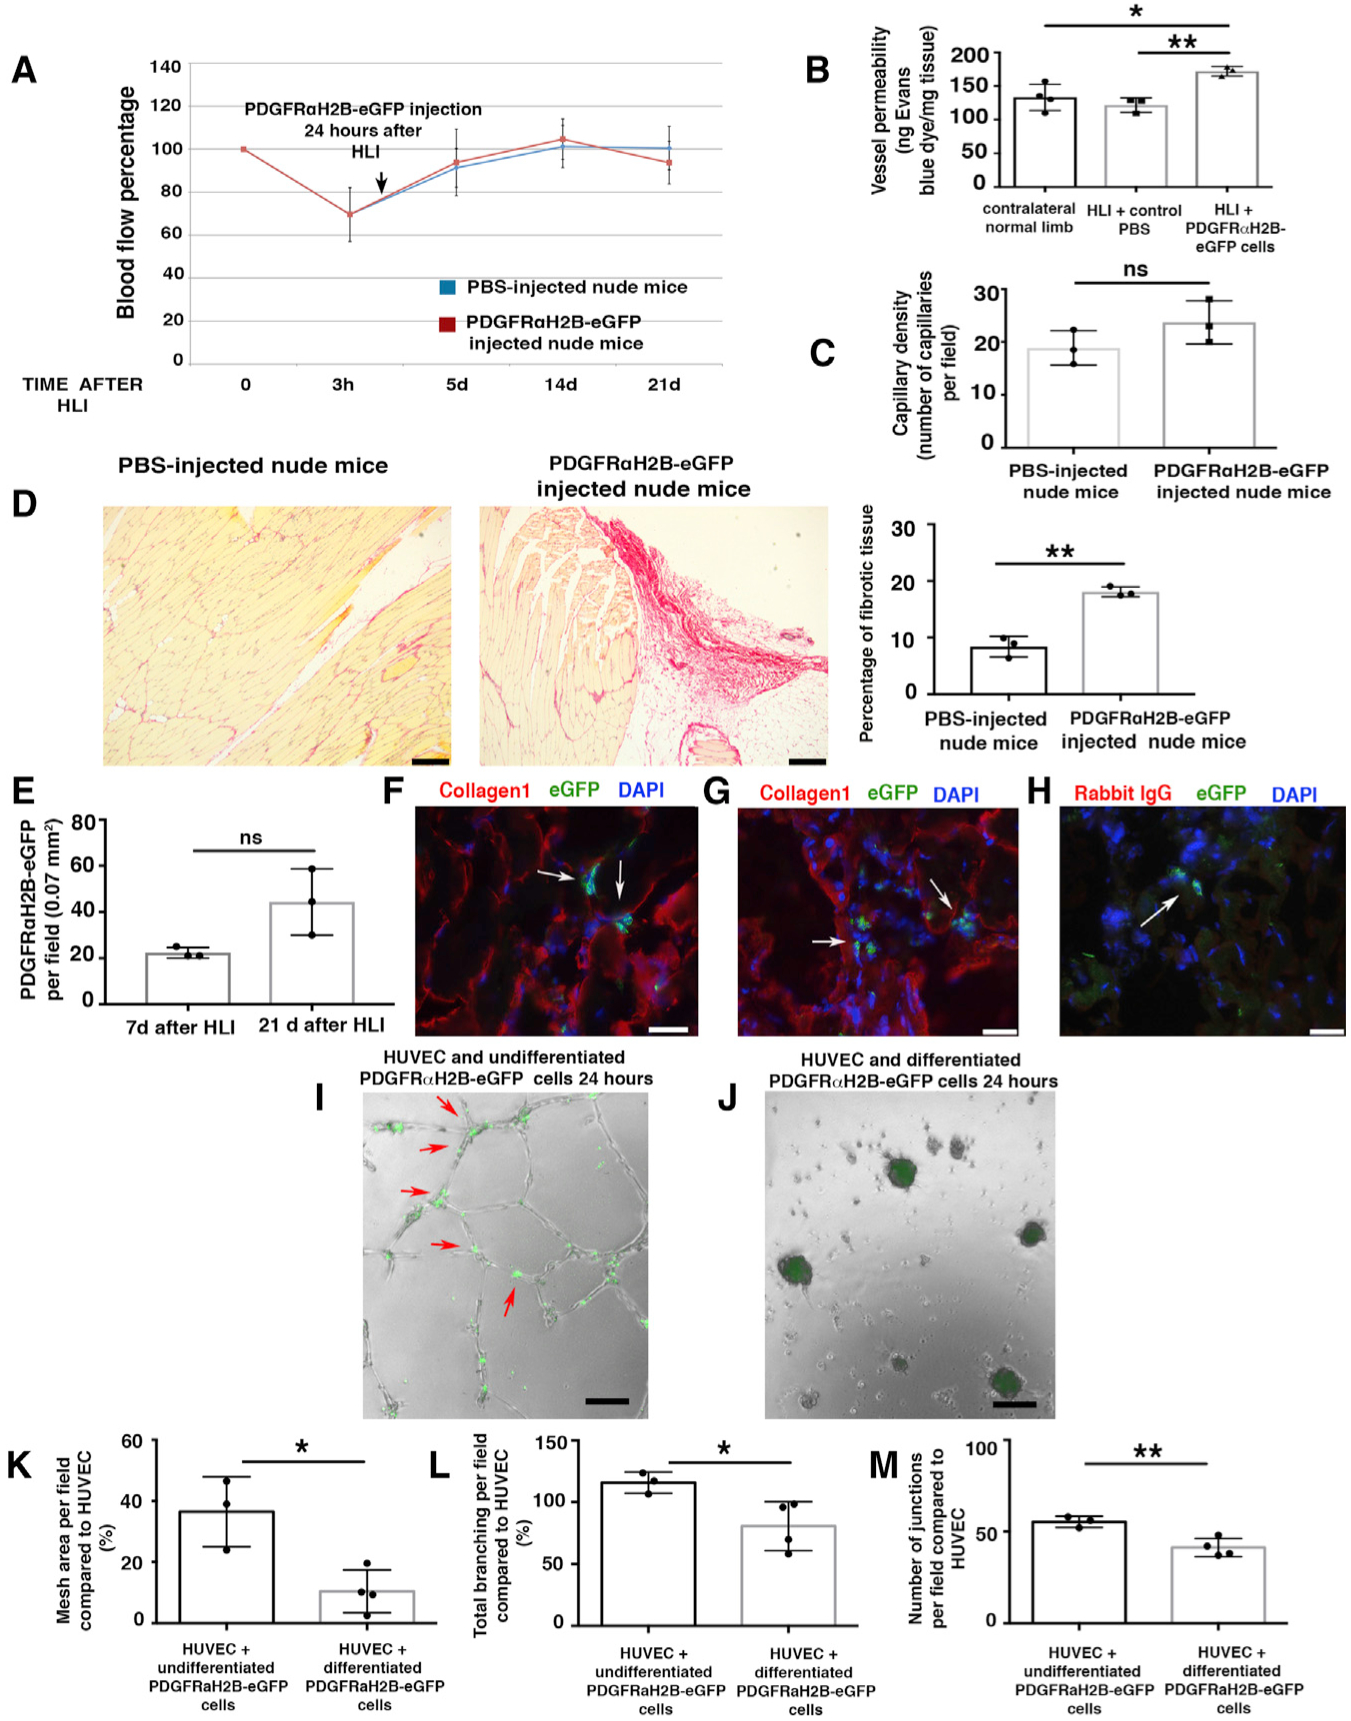
Figure 6. Differentiated PDGFRα+-Derived Cells Impair Healing after HLI.

(A) HLI was induced in 3-month-old female nude mice. Local injection of 7 × 10⁵ differentiated GFP+PDGFRα+ cells from 3-month-old male PDGFRαH2B-eGfp mice, or PBS, was performed 24 h after HLI induction. Blood flow was assessed as indicated in STAR Methods. Nineteen mice were analyzed at time 0 and randomized to control (PBS injected, n = 10) and cell-injected (n = 9) groups. Statistical analysis performed using 1-way ANOVA and Tukey’s multiple comparison test. There were no differences between the groups.
(B) Vessel permeability 21 days after HLI was determined as reported (Radu and Chernoff, 2013). Values were normalized per milligram of tissue isolated. The graph represents the average of n = 4 independent experiments for normal contralateral limb, n = 3 for both PBS-injected and differentiated PDGFRαH2B-eGfp+ cell-injected limbs. Groups compared using 1-way ANOVA and Tukey’s multiple comparison test. Data represent means ± SDs. *p < 0.05, **p < 0.01.
(C) Isolectin B4 staining performed as described (Wen et al., 2005) from cell- and PBS-injected mice. Capillaries were counted in an area of 0.1 mm2 (capillary density). The graph shows the average of n = 3 independent experiments as calculated by Student’s t test. ns represents p = 0.18. Data represent means ± SDs.
(D) Picrosirius red staining of skeletal muscle from PBS- and cell-injected nude mice 21 days after HLI. Scale bars, 250 Pro-inflammatory m. Images representative of n = 3 independent experiments. Scar area was calculated using ImageJ and analyzed by Student’s t test. **p < 0.01. Data represent means ± SDs.
(E) Injected cells were tracked by nuclear GFP expression. Quantification performed using ImageJ. GFP+PDGFRα+ co-positive cells were counted in each field, where the presence of the cells was maximal. Data represent means ± SDs and differences were not significant (ns) among groups.
(F–H) Adductor muscle sections were labeled with anti-GFP FITC-conjugated antibody and anti-collagen1 antibody. Images are representative overlays of n = 3 independent experiments and show the presence of PDGFRαH2B-eGfp+ cells (white arrows) in an area of fibrotic tissue in proximity to skeletal muscle fibers (F) or in areas with extended collagen deposition (G). Images acquired with a Leica CTR 5500 microscope and DFC340FX camera. Scale bar, 20 μm. (H) Control for collagen1 staining using rabbit IgG as the primary antibody. Anti-GFP FITC-conjugated antibody was used to detect injected cells. Individual color panels from (F), (G), and (H) are presented in Figure S6F.
(I–M) Modulation of in vitro tubulogenesis by PDGFRα+ cells. (I and J) HUVECs were plated and co-cultured with undifferentiated freshly sorted GFP+PDGFRα+ cells (I) or differentiated myofibroblast-like GFP+PDGFRα+ cells from PDGFRαH2B-eGfp mice (J). Cells were co-cultured and GFP+PDGFRα+ cells were tracked by GFP expression. Analysis was performed 24 h after plating and recorded with an EVOS AMG imaging system (Thermo Fisher Scientific). In (I), arrows show aligned GFP+PDGFRα+ cells associated with in vitro tubules. Scale bar, 100 μm. (K–M) Quantification of mesh area (total tube area) (K), total branching (amount of branches expanding from nodes) (L), and number of junctions (extent of vessel branching) (M) from cultures of HUVEC alone and HUVEC co-cultures with differentiated and undifferentiated PDGFRα+ cells after 7 h of co-culture. ImageJ angiogenesis software was used for quantification. Data represent n = 4 independent experiments for HUVEC+differentiated GFP+PDGFRα+ cells and n = 3 for HUVEC+undifferentiated GFP+PDGFRα+ cells. *p < 0.05 and **p < 0.01. Data calculated by Student’s t test and represent means ± SDs.
