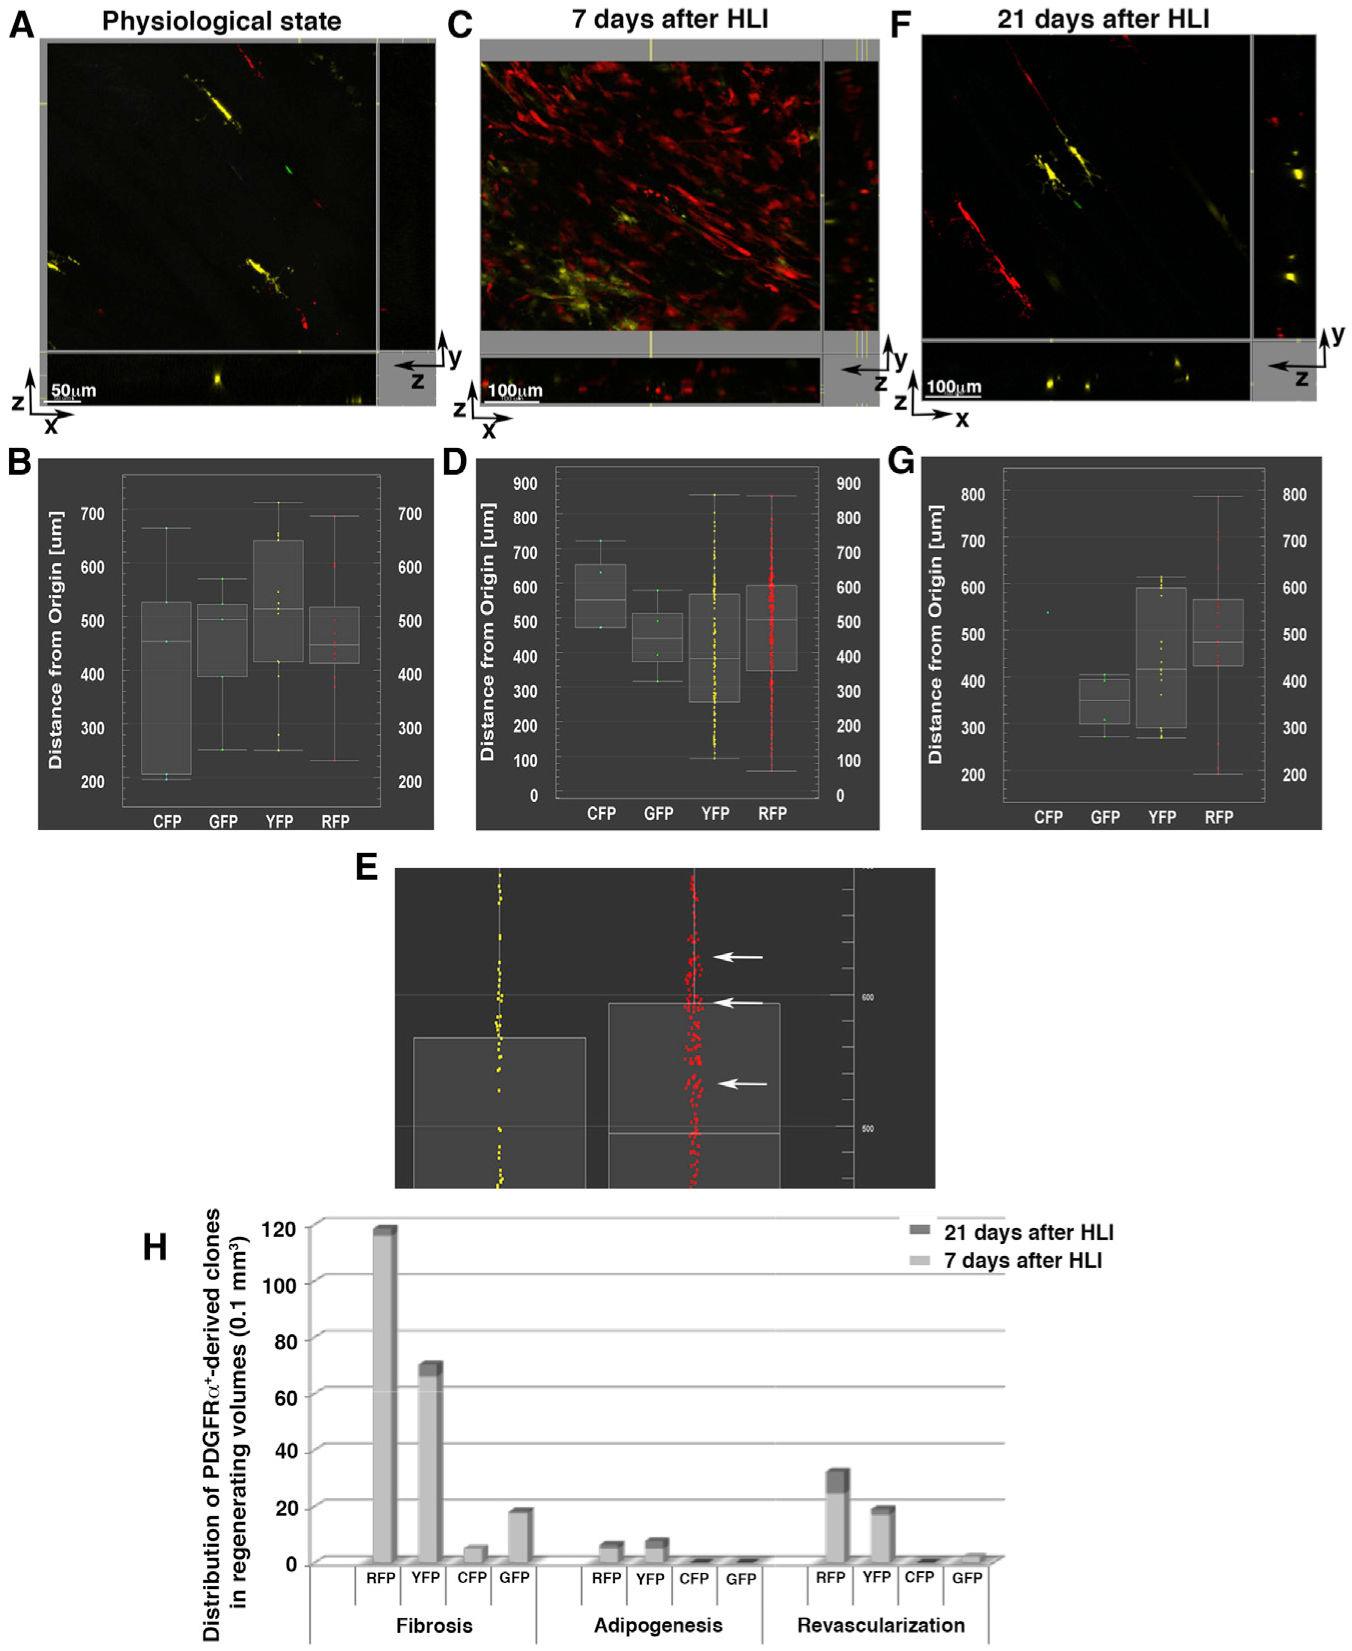
Figure 7. In Vivo Expansion and Differentiation of PDGFRα+ Cells.

Using MCM+/R26R-Brainbow+/− mice, we studied the expansion and differentiation of PDGFRα+ cells and their progeny after HLI.
(A, C, and F) 3D microscopy images presented as x-y, x-z, and y-z views. Fluorescent channels (pseudo-colored cyan for CFP, green for GFP, yellow for YFP, red for RFP) are displayed in a physiological (uninjured) state (A), 7 days after HLI induction (C), and 21 days after HLI induction (F) and were used to analyze 1D-view plots. The images are representative of analyses performed in different locations in 3 independent mice for each condition. Scale bars as indicated.
(B, D, E, and G) 1D-view plots of cell distributions based on their distances from the origin (x-y axis) showing CFP+, GFP+, YFP+, and RFP+ cells in a physiological state (B), 7 days after HLI induction (D and E), and 21 days after HLI (G). (E) Enlarged view of (D) highlighting YFP+ and RFP+ cells and clones. At 7 days after HLI, PDGFRα+ YFP+ and RFP+ clones increased in number (see Figures S9 and S10). In addition, RFP+ cells formed small clusters throughout the 3D volume (E, white arrows), compared to scattered distributions at other time points, suggesting that at this time point, PDGFRα+-derived RFP+ cell clones were retained in proximity to their original niche.
(H) The average number of PDGFRα+-derived RFP+, YFP+, CFP+, and GFP+ clones was quantified in 3 independent mice for each time point after HLI induction (7 and 21 days) using second harmonic generation (SHG) images to distinguish fibrotic, adipocytic, and revascularized areas. Quantification was accomplished by counting PDGFRα+-derived cells present in z stacked images per 0.1 mm3 volume.
