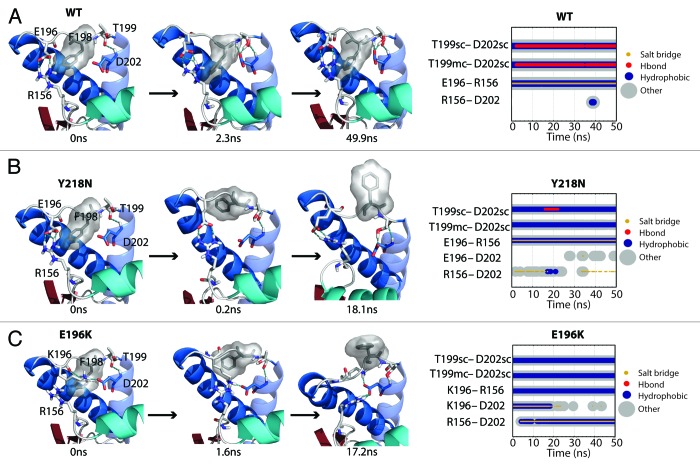
Figure 6. Salt bridge network around the F198 side chain. (A, B and C) Structures at specific time points of the WT simulation 2, Y218N simulation 1, and E196K simulation 2, respectively. Secondary structure color schemes are cyan for HA, blue for HB and HC, where the transparent helix is HC. Residues E/K196, F198, T199, D202, and R156 are shown in sticks and hydrogen bonds are indicated with dotted blue lines. (far right) Relevant contacts are plotted over time.

An official website of the United States government
Here's how you know
Official websites use .gov
A
.gov website belongs to an official
government organization in the United States.
Secure .gov websites use HTTPS
A lock (
) or https:// means you've safely
connected to the .gov website. Share sensitive
information only on official, secure websites.
